Housing market monitor - Income growth and a shortage of new supply are pushing up prices

We expect house price growth of 8.7% by 2025 (was 8%). Price growth is driven primarily by income growth and supply shortage. Housing transactions are expected to increase by 12.5% in 2025. Sales of investment properties boost housing transactions.

Mike Langen
Senior Economist Housing Market
Dutch house prices are climbing with the same speed as in 2024
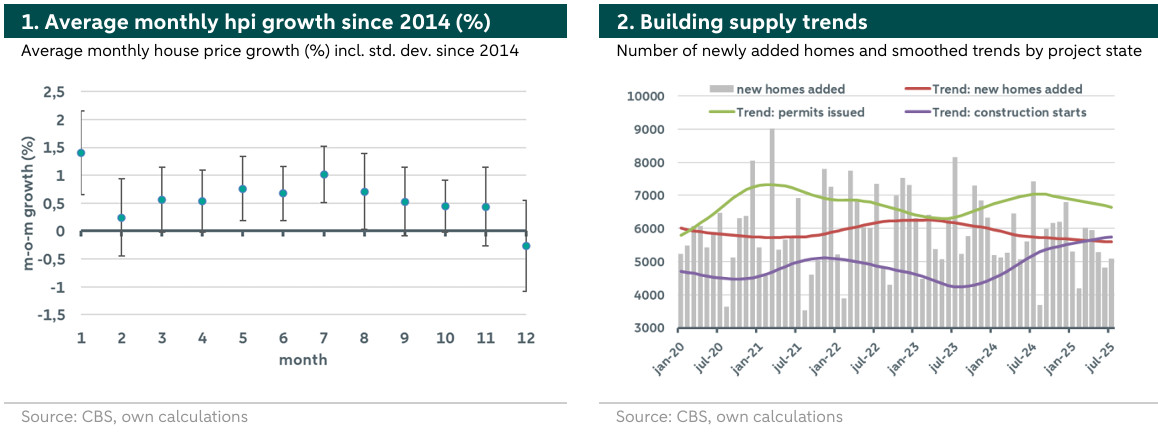
In the third quarter of the year it becomes clear that Dutch house prices will grow significantly again. Prices are currently up 7.7% compared to last year. Assuming house prices will continue to grow for the rest of the year, we expect the yearly house price growth to come above 8% in 2025. The fundamentals indicate that this scenario is indeed very likely (see paragraphs below). But also the technical analysis suggests such a scenario and gives some hints about the magnitude. Figure 1 shows the average monthly house price growth per month of the last 10 years. We can see that house price growth usually decreases slightly as of August, but remains slightly positive until November. In December we historically see a price drop followed by a sharp price rise in January. Considering this pattern combined with the fundamentals of the housing market, we expect house prices continue to growth and therefore raise our price growth forecast for 2025 to 8.7% (was 8%). For 2026, we expect demand to slow down and supply to slowly pick up. We therefore leave our price forecast for 2026 constant at 3%.
Higher household incomes fuel the demand for housing.
On the demand side we see that household incomes are still increasing, even though at a slowing rate. In August, wages under the collective labour agreement (CAO) went up while inflation came in at, indicating that wages are still increasing in real terms. In the second quarter of the year, real disposable household income went up , suggesting that incomes are still raising more than costs. However, we expect the rate to slow down next year, which could slow down housing demand as of next year. At the same time, we recently adjusted our expectations on the course of the European Central Bank (ECB), no further rate cuts in the short-term. We therefore expect mortgage interest rates to stay more or less constant, as they are since a few months. Due to increasing government debt among EU countries, we could even see some rate hikes for long-term government bonds in the future. This would likely affect mortgage rates with long time to maturity dates (>10 years), making financing even slightly more expensive and thus negatively impacting demand further.
Building supply is still below its target rate, despite more construction starts
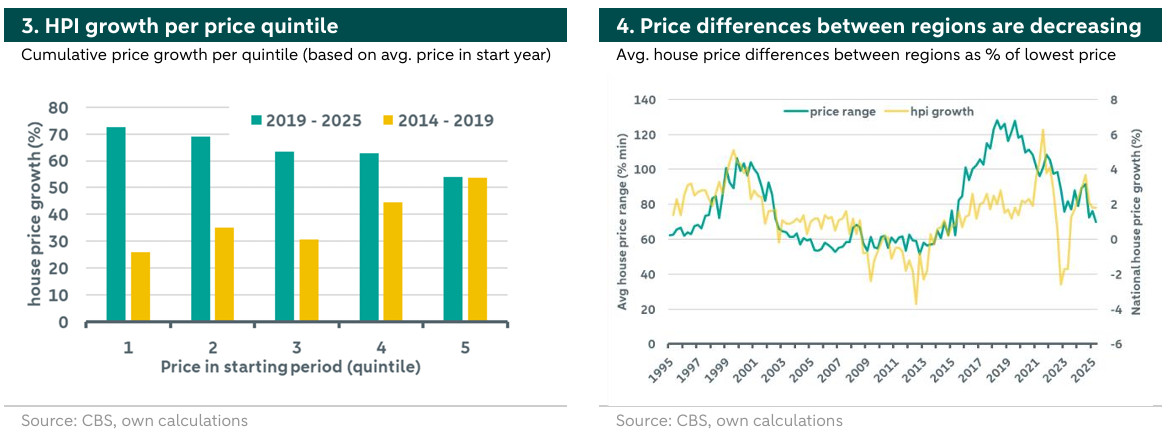
On the supply side, we see building activities trailing those of 2024. In the first eight months of the year, approximately homes were added, 8.2% less than over the same period in 2024. Given that in 2024 only 69,000 new homes were added to the market, we therefore also expect that the target of 100,000 new homes per year will be missed again in 2025. Figure 2 shows the number of added homes per month and different trend series*. When adjusting for seasonal components (e.g. construction holidays in the summer), we see the trend of newly added homes is flat or even slightly decreasing. We further see the trend of issued building permits, indicating a downward trend since last year. On a positive note, we see the number of projects with construction starts is increasing since two years. This indicates that the number of newly added homes might increase again as of next year. Overall, the statistics indicate that the supply shortage remains in the short-term but that there is some silver lining with more construction starts.
Regional price differences tell us about the market dynamics
To examine the price growth dynamics further, we look at regional price differences. Figure 3 shows the average regional house price growth for different regions, sorted by initial price quintiles. For the period between 2019 until today, we see that regions with lower initial prices, such as rural provinces, show stronger overall house price growth than areas with initially higher prices, such as Amsterdam. Prices in those “cheaper” regions are catching up. Interestingly, for the period 2014 to 2019 we see a reverse pattern, where regions with initially higher prices grew stronger. In Figure 4 we plot quarterly price range of different regions over time as a percentage of the minimum price**. For example, in the first quarter of 1995, the most expensive region showed average house prices 60% higher than the least expensive region. We can see that during the time of housing booms, such as in 1999 to 2000 or 2015 to 2020, the range increases. Expensive regions show stronger price growth during the beginnings of these booms. However, at some point, the range narrows, as “cheaper” regions catch-up. The underlying reasons are manyfold, but usually this indicates the end of the boom. We are currently seeing that price differences between regions are shrinking, a sign that overall house price growth might slow down.
Transactions are still increasing, but the main boost seems gone
Transactions are still at a record high, mainly due to the sales of former investment properties. In the first eight months of the year there were 149,534 transactions, 16% more than in the same period in 2024. We can therefore expect a record year based on the number of transactions, after 2021 and 2017. The dynamics are different thought, as this year is dominated by the sale of former investment properties. In the second quarter of the year, investors sold around investment properties, an year-on-year increase of 42%. However, not all of these properties ended up with starters, as investors also bought 7,800 homes, an year-on-year increase of 50%. The reason for increased sale of investment properties are rent caps for homes in the middle rent segment and higher taxation of investment properties. However, the effects of this transaction boost seems to be incorporated for this year, as the year-on-year difference is decreasing. While in June and July 2025 there were 28.8% and 13.9% more transactions than in the same months in 2024, in August it were only 8.6%. We therefore leave our forecasts constant at a 12.5% transaction increase for 2025 and 1% increase for 2026.
* We estimate seasonal adjusted trends with LOESS. ** We calculate the minimum and maximum average house prices per quarter out of all regions and calculate the range.