More billions for renewable energy, but the electricity grid remains a constraint

Many of the EU’s ambitions require substantial investment. This analysis focuses on the trend in investment in renewable energy, in both the short and long term. To put the picture into perspective, we first examine investment dynamics in the European Union (EU) and how investment in renewable energy compares with investment in the energy transition. The EU has set itself a legally binding target for renewables: by 2030, at least 42.5 per cent of final energy consumption must come from renewable sources, such as wind, solar and hydro power, biomass and geothermal energy. We examine how much scope remains for each EU Member State to meet the EU targets and which renewable energy sources Europe currently relies on most heavily. Based on an average investment per megawatt, we have estimated the future EU investment required. Finally, for wind and solar energy – for which specific EU targets have also been set – we estimate the additional investment required up to 2030 to ensure these European ambitions are also realised.
EU investment in renewable energy rose by 110% between 2020 and 2025, while the current pace and existing plans fall short of meeting climate targets, creating more autonomy and greater energy security
The challenge looking ahead to 2030 remains significant: at least 42.5% of final energy consumption must come from renewables;
Progress varies greatly between Member States, with most EU-countries still lagging far behind
By 2050, the EU will require approximately EUR 2.8 trillion in investment for additional renewable generation capacity – primarily wind and solar – to meet climate targets
Grid congestion is a key bottleneck: many renewable projects are at risk of not being connected to the grid by 2030
Increased renewable energy generation therefore requires simultaneous measures on the grid
Trend in investments in renewable energy in the EU
Renewable energy is at the heart of the European agenda. Whilst the energy transition was once driven by climate targets, it now also forms a key pillar of European energy and industrial policy. The roll-out of renewable energy has now been incorporated into a wide range of EU ambitions. These range from further accelerating the shift towards sustainability to strengthening energy security and strategic autonomy. Moreover, the European economy’s geopolitical strategy and international competitiveness remain closely intertwined with renewable energy. Expanding the generation capacity of renewable energy sources has therefore become more important than ever. The good news is that many EU Member States have increased the share of renewable energy sources in their energy mix in recent years. However, for the majority of EU countries, investment in renewable energy has so far been insufficient to realise the EU’s ambitions.
According to Bloomberg New Energy Finance (BNEF), investment in the energy transition (which includes renewable energy, grids and energy efficiency) totalled approximately USD 450 billion in 2025, reaching a record high. Investment in renewable energy within the EU has also risen sharply in recent years, particularly since the energy crisis of 2022. Many EU Member States have significantly stepped up investment in renewable energy since 2022 to achieve greater energy security and autonomy.
The figure on the left below shows total investment in the energy transition over a 20-year period since 2005. Prior to 2014, these investments consisted solely of investments in renewable energy. From 2014 onwards, non-renewable transition investments have been increasing rapidly. These include investments in, for example, electrification, grids, storage, clean transport and other decarbonisation technologies. In the period 2020–2025, total EU investment in the energy transition increased by 158%. Non-renewable transition investments rose by 183% over the same period, whilst investment in renewable energy increased by 110%.
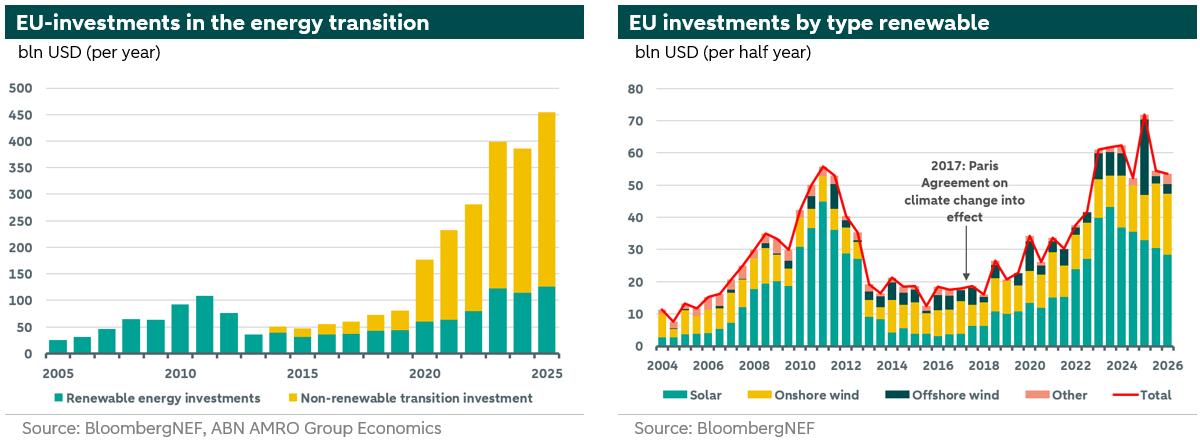
When it comes to investment in renewable energy, we focus primarily on wind and solar energy, the main drivers of growth in recent years. This is illustrated in the figure on the right above. Investment in solar energy still predominates in the EU. Between 2020 and 2025, this investment increased by 149%. Investment in offshore wind energy rose by 112% and onshore wind energy by 70% over the same period. The sharp rise in investment in offshore wind energy in the first half of 2025 was mainly due to the completion of a handful of large projects – particularly in Poland. Following the exceptional peak in the first half of 2025, investment levels were lower in the subsequent period. In addition, investors became increasingly cautious due to persistent grid congestion in many EU countries. However, driven by the rapid growth of wind and solar energy, investment in electricity grids is also gradually increasing.
Of all EU Member States, Germany is the largest investor in renewable energy, closely followed by France. Italy trails some way behind. The Netherlands ranks sixth within the EU in terms of investment volume.
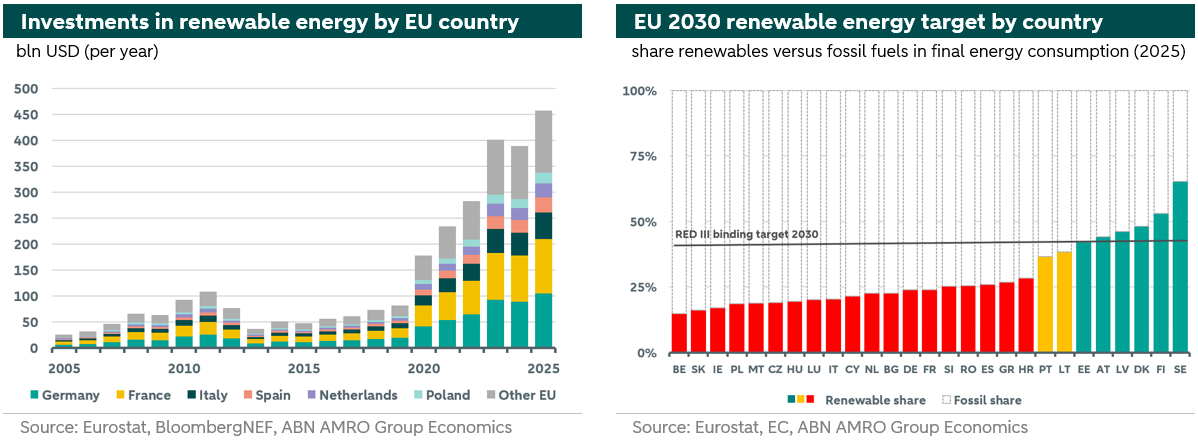
Not only the level of investment in renewables, but also the share of renewable energy in final energy consumption varies considerably between EU Member States (see the figure on the right above), with Sweden achieving the highest share in 2024, followed by Finland, whilst Belgium and Slovakia have the lowest shares.
Between 2005 and 2025, the share of renewable energy sources in the EU’s final energy consumption more than doubled. Renewable energy sources will continue to grow in Europe. The Renewable Energy Directive (RED III, 2023 revision) has, in fact, set a binding EU-wide target to increase the share of renewable energy sources to at least 42.5% of the EU’s final energy consumption by 2030. The aim of RED III is to accelerate the transition to renewable energy. In doing so, the EU seeks to reduce greenhouse gas emissions more significantly and enhance energy security within the EU. However, the accelerated roll-out of renewable energy sources still faces obstacles at both European and national levels. The main obstacles are the sometimes relatively high capital costs (particularly for wind energy), the existing capacity of electricity grids in EU countries, and lengthy licensing procedures.
Needed investments for renewable energy in the EU
To estimate future investment requirements, we first examine the relationship between the expansion of renewable capacity and the historical investments required to achieve this. The figure on the left below shows a clear positive correlation between the annual expansion of renewable capacity in the EU and the annual investments made in it. Annual capacity expansion eventually reached around 70–74 GW, whilst investment rose to roughly EUR 105–115 billion per year. The development of capacity has followed investment trends relatively closely in recent years, though not perfectly. This is because investment decisions are often taken well before the actual installation takes place. Particularly in the case of larger wind energy projects, there can sometimes be a gap of several years. Nevertheless, there is a link, and investment per megawatt therefore provides a suitable basis and benchmark for scenario analyses.
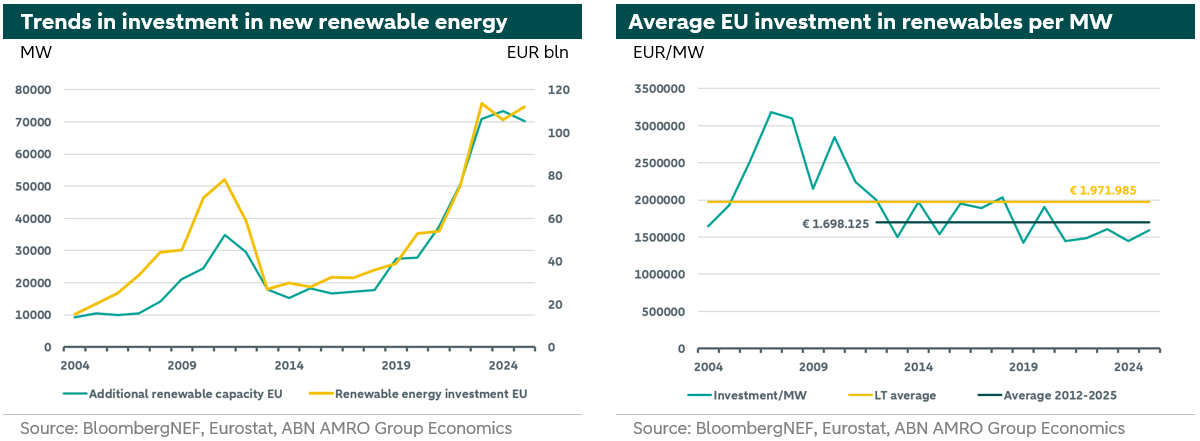
The sharp decline in investment in renewable energy associated with a relatively lower decrease in capacity additions shown in the left-hand figure between 2011 and 2013 is due to the steep fall in costs – particularly for solar energy – the phasing out of various subsidy schemes that had been generously set up during the initial start-up phase, and the economic recession in Europe that intensified in the autumn of 2011.
The figure on the right above shows investment intensity in euros per megawatt. The yellow line represents the long-term average and the dark green line the average for the period 2012–2025. The figure shows that, since the peaks of 2007–2010, investment intensity has fallen structurally to a lower level and that it exhibits annual volatility, due to for example macro-economic trends and/or shocks, energy price trends or interest rates. The downward trend after 2010 is partly consistent with the economic mechanism of technological learning and economies of scale, such as increased production, greater experience, standardisation and efficiency. Over the period 2012–2025, investment intensity fluctuates within a relatively narrow range around the average. Using this historical average as a starting point, we can translate future capacity expansion into an indicative investment requirement.
We use the average investment intensity over the period 2012–2025 in our calculation of the investments required in renewable energy up to and including 2050. These investments depend on the additional renewable capacity to be added in the EU during the period 2026–2050. To this end, IRENA – the International Renewable Energy Agency – has mapped out two possible pathways: one shows the additional capacity based on current policy (PES) and the other shows how much extra capacity is required under the scenario to meet the climate targets (DES). This is illustrated in the figure on the left below, which also clearly shows that there is a significant gap between the two separate pathways. More specifically, this means that the targets will not be met at the current pace and with the current plans. In our calculations, we use the annual additional capacity from the DES pathway and the average investment intensity from the period 2012–2025 to assess the investments required up to 2050.
The results of our calculations can be found in the figure on the right below. In our baseline scenario, we arrive at a total required investment in renewable energy of EUR 2.8 trillion by 2050. This conclusion is in line with the expectations of IRENA and the European Commission (EC) in their 2025 report ‘EU Regional Energy Transition Outlook’.
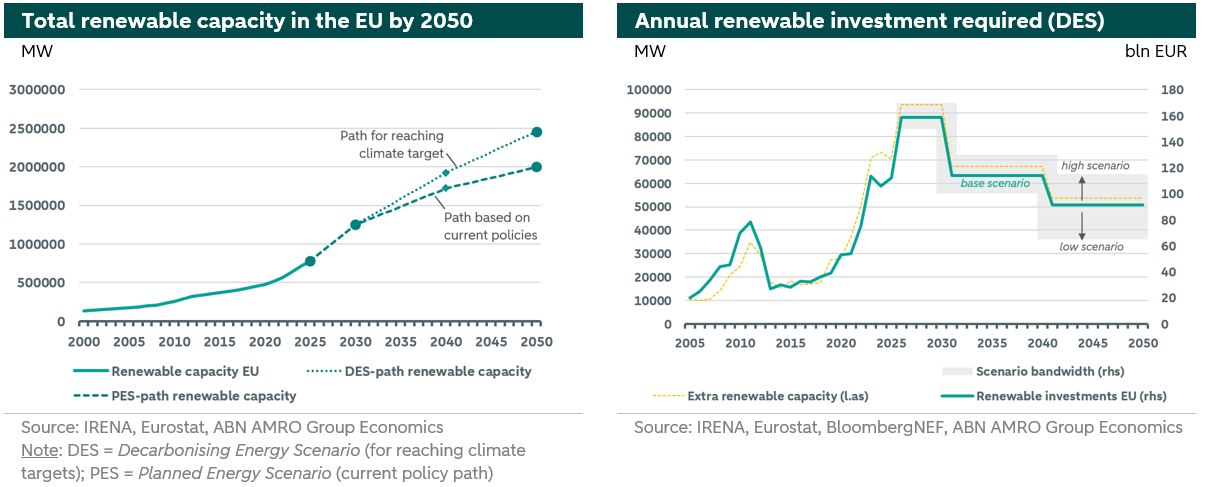
The green line in the figure on the top right shows our baseline scenario for required investment. It illustrates that investment requirements peak mainly between 2025 and 2030, before settling at a level not much higher than current investment levels. The yellow line illustrates the trend in additional capacity per year. As our baseline scenario is based on historical averages, this is not necessarily representative of future investment. We therefore use a range to help interpret future investment levels. This is shown by the grey areas in the figure. We apply an illustrative range around the baseline scenario to illustrate the sensitivity of the results to alternative developments. This range remains relatively narrow for the period up to and including 2030, but widens for the years thereafter, in line with the increasing uncertainty as the forecast period extends. It is important to note that this range is explicitly not a statistically determined margin of uncertainty. The further ahead we look, the greater the uncertainty regarding the required investment amount. Both the future technology mix and cost trends play a role in this.
For example, investment per megawatt can vary considerably between different types of renewable energy. Investment in solar energy, for instance, is much lower per MW than investment in wind energy. Any shift in the renewable energy mix can have a significant impact on total investment. Furthermore, investment is strongly influenced by inflation, interest rates, wage trends and raw material prices. These are difficult to predict in the long term, as they depend not only on economic trends but also on unexpected shocks, government policy, end-user behaviour and technological innovation. Furthermore, the baseline scenario does not take into account economies of scale, more efficient production, larger turbines and more efficient solar panels, all of which can reduce costs in the long term.
In addition to the cost per megawatt, it is also important to consider the amount of electricity the installed capacity generates. The capacity factor plays a role here. Once the capacity has been installed, it is also necessary to consider how much electricity is generated with that invested capital. Generally speaking, the higher the capacity factor, the more electricity the installation produces per year and the more readily the investment can be recouped. The trend in the capacity factor for each renewable technology thus indirectly influences investment decisions and the level of investment.
Investments in wind and solar
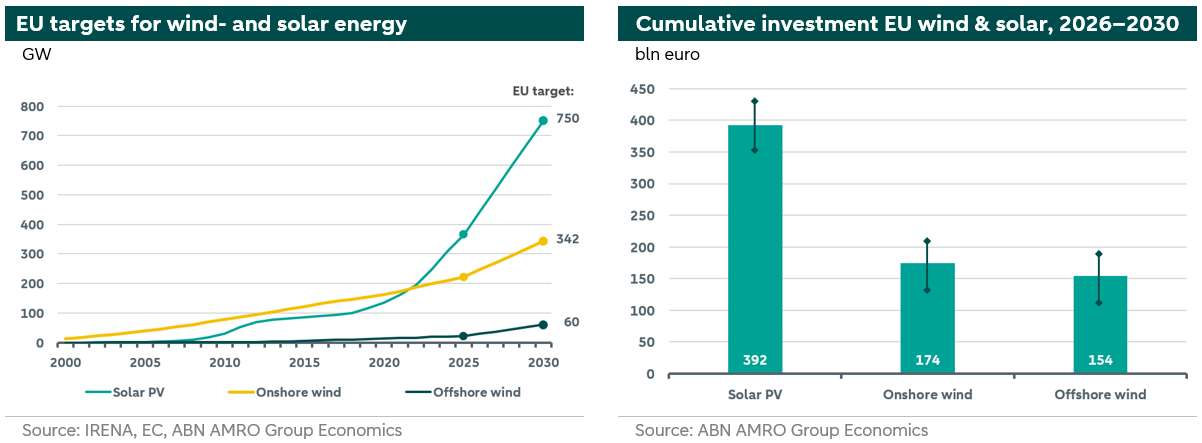
Following the long-term forecast for renewable energy, we now turn our attention to the investment requirements for wind and solar power up to 2030. As wind and solar power are the main renewable sources in the EU, separate targets have been set for these towards 2030. These are shown in the figure on the left below. The ambitions for each technology are high.
Compared with the installed capacity in 2025, solar energy capacity should ideally more than double over the next five years. Onshore wind capacity is expected to increase by 54% and offshore wind capacity by 178% over the next five years. These targets demonstrate that the investment requirements for both solar and wind energy are set to rise in the coming years. The cumulative investments up to 2030 are shown in the figure on the right below.
However, whether these investments can be realised in time also depends on the available grid capacity. Without an accelerated expansion of the electricity grid, the targets will be difficult to achieve. In mid-2026, the EC indicated that there are connection queues in at least 16 EU countries. As a result, a total of approximately 120 GW of relatively mature renewable energy projects are at risk of not being connected by 2030.
Conclusion
Europe is investing more than ever in the energy transition, but record levels of investment are no guarantee that renewable energy targets will be met. Given the existing plans and the current pace of progress in Europe, the task appears difficult to achieve. Renewable generation and grid expansion are parallel challenges, with increasing the capacity on the existing grid deserving priority. This can be achieved through additional investment, but grid congestion can also be partially reduced through smarter and more flexible grid use, storage, demand response and site selection.
The financial challenge involved in expanding renewable generation capacity alone is considerable: our baseline scenario indicates that approximately EUR 2.8 trillion in investment in renewable capacity will be required by 2050. As we approach 2030, this challenge becomes more tangible. Solar power capacity must more than double compared with 2025, whilst onshore and offshore wind power must grow by 54% and 178% respectively. Investing more in renewable generation remains essential, but that alone will not be enough. This also makes the expansion of the electricity grid crucial to the final investment decision.