ESG Strategist – Investigating commonly-cited factors of the greenium

Earlier this year, we wrote about how euro investment grade (IG) green bonds exhibit lower volatility and, in most cases, also offer slightly higher liquidity, the latter based on Bloomberg LQA scores, bid-ask spread relationships and relative trading volumes [1]. Our analysis helps to explain the presence of a greenium over time: that is, why investors might be willing to accept a higher price (lower spread) for green bonds in comparison to non-green bonds. In this note, we delve further into the dynamics of the greenium. More specifically, we are interested in understanding the potential drivers of the greenium and if existing research on the topic is still valid when considering more recent data.
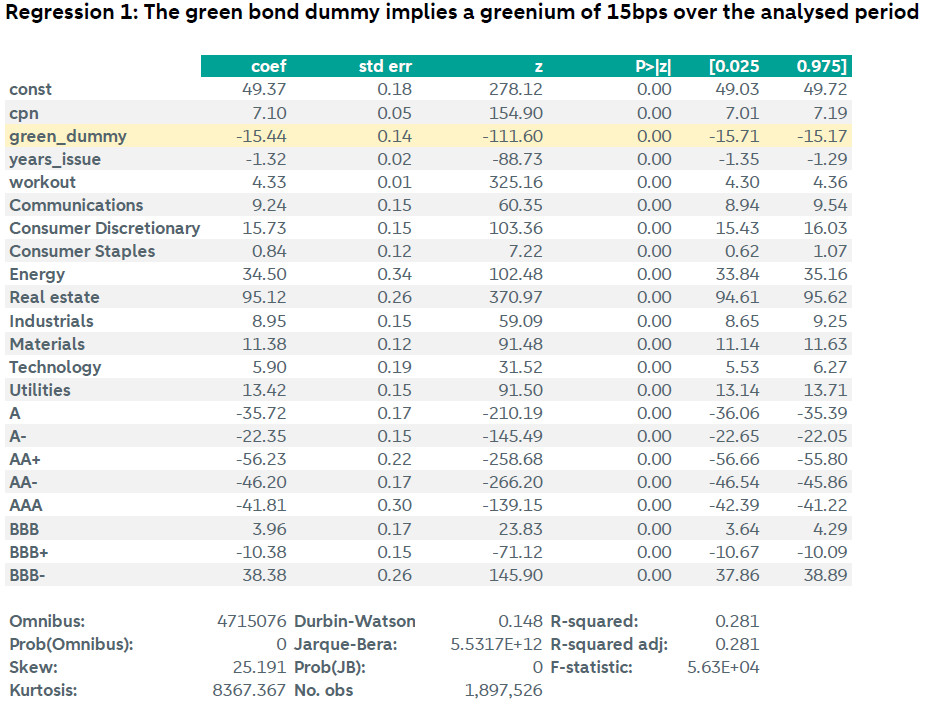
By using a sample of daily bond spreads over the last three years on a sample of 3,500 securities, we find a statistically significant greenium of 15bps over the analysed period
We find that the greenium is higher if the issuer comes from a high-impact sector and if the issue refers to a debut green bond
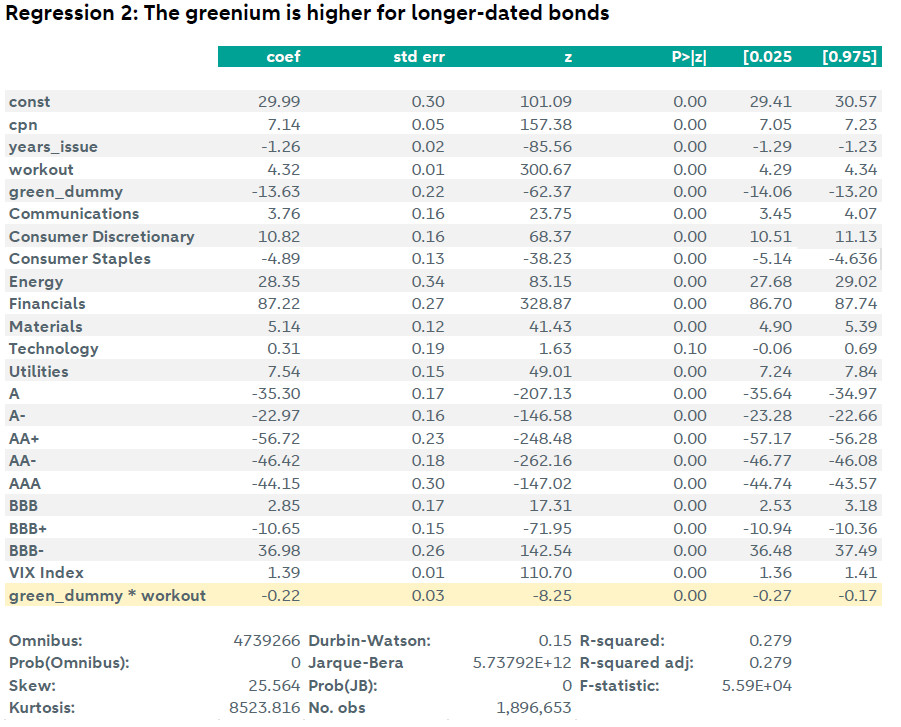
Longer-dated bonds show a slightly larger greenium, but the increase is limited to only 0.2bps per each additional year to maturity
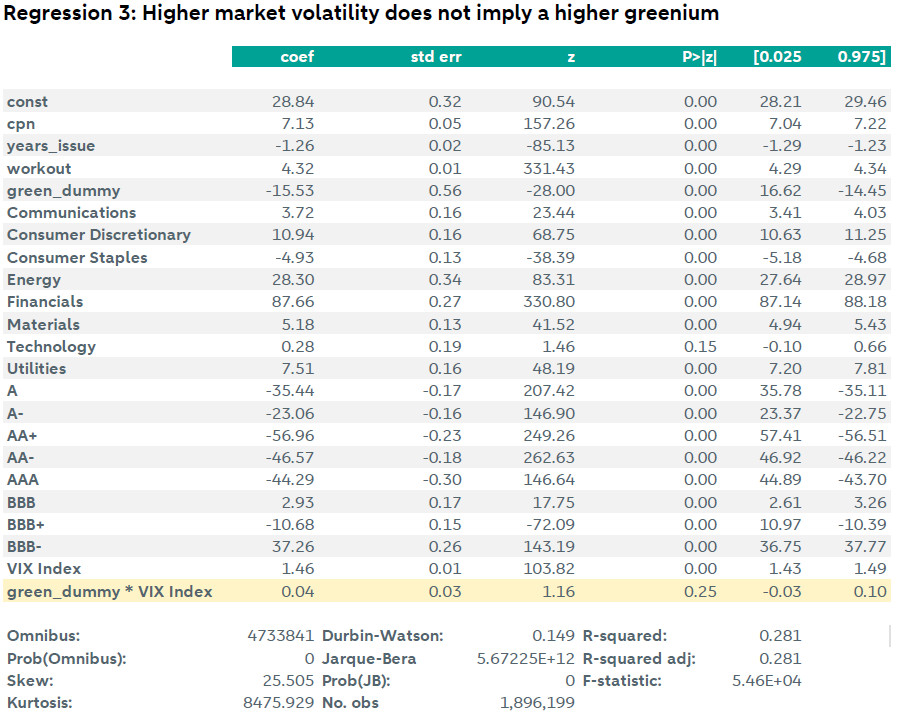
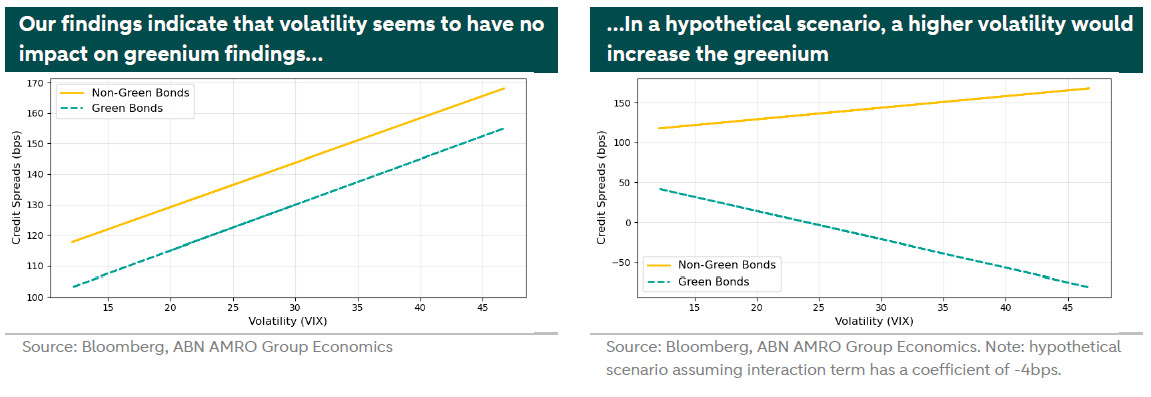
We do not find evidence that the greenium is impacted by market volatility
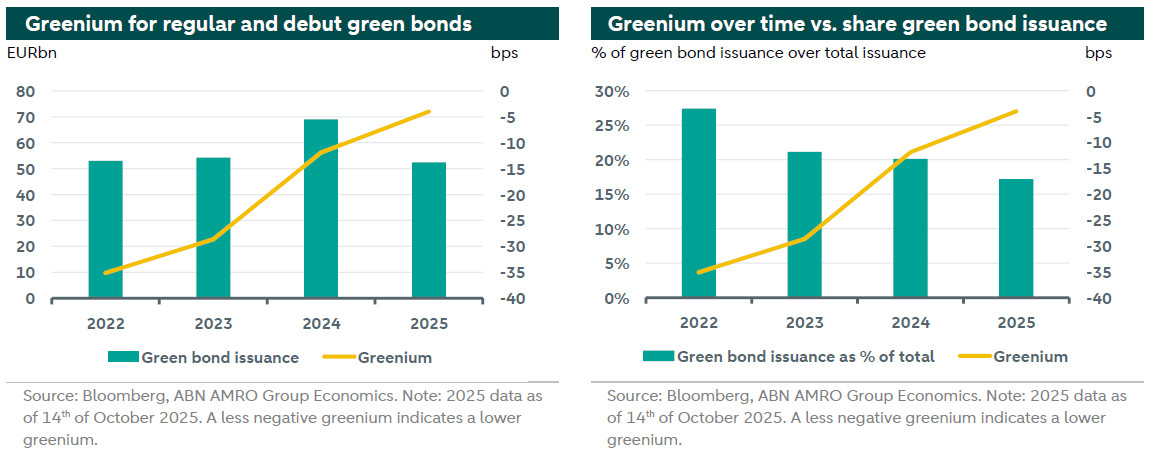
The greenium decreased over time, which coincides with higher green bond issuance volume. However, it also coincides with years where the share of green bond issuance relative to the total market was lower…
…We therefore conclude that the greenium is not directly impacted by issuance volume
For the purpose of this analysis, we use a panel data containing euro bonds, with a fixed coupon and a minimum issuance size of EUR 500m, issued by non-financial corporates with an investment grade rating. From such a sample, we extract daily bond spreads over the last three years. That results in a significant sample size of almost two million data points covering around 3,500 securities.
Literature estimates greenium in various ways, such as pairing green bonds with similar non-green bonds and regressing the spread difference. Instead, we opted for an approach where bond spreads are used as the dependent variable in our regression model and where we include a dummy variable that assumes the value of 1 if the bond is green and 0 otherwise. We additionally control for various factors that could influence bond spreads, such as the issue’s rating, the issuer’s sector, the years to bond maturity, the number of years since bond issuance and the bond coupon. This method allows us to have a larger sample, although the analysis becomes more complex. We note that all of the green bonds in our sample have obtained an external review (such as a certification and/or second party opinion). A previous study by the ECB () finds that the greenium is higher for bonds that received an external review. As such, this could also be driving upwards our greenium estimates.
1. Yes, there is a greenium – and it is large
The first question we are interested in answering is whether there is a statistically significant greenium over the analysed period. Our results indicate that yes, there is a greenium of 15bps. That is, green bonds traded on average at 15bps tighter credit spreads over the last three years, all else equal, and this result is statistically significant (please refer to the appendix for the full regression output). The greenium has however reduced over time, and when running our regression model on only 2025 data, we get to a greenium that is as low as 4bps (we explore this topic in section #4 below).
Following the conclusion that there is a greenium, we would like to investigate whether such greenium is higher and/or lower in specific cases. In our recently conducted annual ESG investor survey (here), investors pointed out that they are more willing to accept a greenium if (among others) the green bond issuer: (i) is new to the green bond market, and/or (ii) demonstrates potential for high ESG impact / emission reductions. In fact, 75% of the respondents said that in these occasions, they would be willing to pay a greenium. Hence, we investigated whether we can find evidence of a higher greenium in these cases.
2. The greenium is higher for high-impact sectors
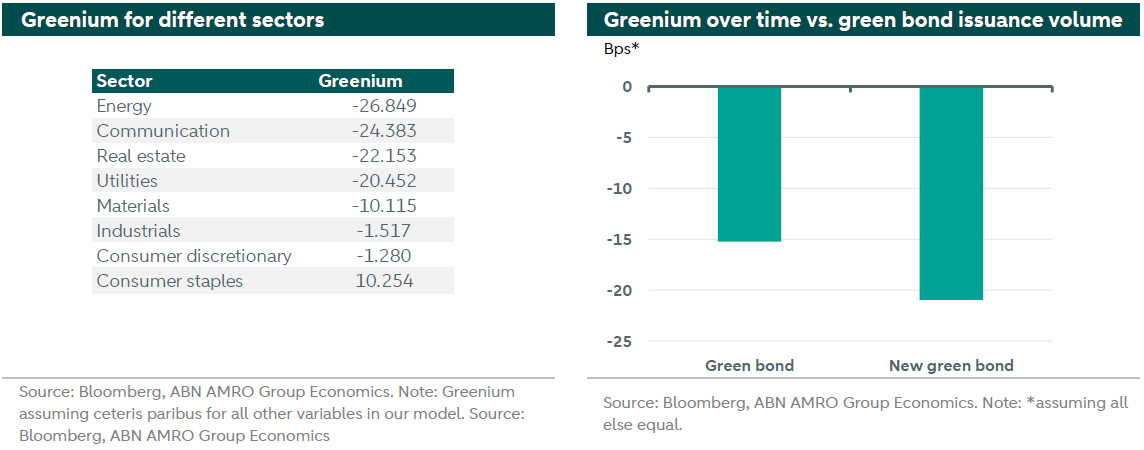
We start by looking at whether the size of the greenium changes if the green bond comes from an issuer that has a high potential for sustainability impact. We have opted for doing this analysis by taking a sector approach. That is, we evaluate whether such hypothesis is true by looking at whether the greenium is stronger for sectors that have high impact on climate and therefore, a corresponding high emission reduction potential. Our analysis indicates that indeed, in most cases, high impact sectors seem to experience a higher greenium (see table below on the left). For example, sectors such as energy, utilities and real estate are amongst the top four sectors with the largest greenium, which can reach up to 27bps, all else equal. At the same time, these are the sectors that most contribute to current GHG emissions globally. These results are also statistically significant. We also observe that in the case of the Consumer Staples sector, the greenium is non-existent. In fact, green bonds issued by companies from this sector experience 10bps wider credit spreads, all else equal.
3. The greenium is higher if it’s a debut sustainability issuance by that entity
As we previously noted, respondents to our ESG investor survey have pointed out that they would be willing to pay for a greenium if the green bond issuer is new to the green bond market, that is – if the green bond is a debut sustainability bond. As such, we made use of the Bloomberg debut sustainability indicator, which indicates if the instrument is an initial sustainability offer by that specific entity. This indicator was added to our regression model in a dummy format, and therefore assumes the value of 1 if the bond is the first green bond of that issuer, and 0 otherwise. By adding the debut sustainability indicator to our model, we are able to evaluate if there is an additional tighter spread experienced by these bonds compared to other green and non-green bonds. And indeed, we find that, over the period analyzed, a debut green bond traded with nearly 21bps tighter credit spreads, all else equal, compared to the 15bps of greenium that we found for a regular green bond (see chart above on the right). That implies an additional 6bps of greenium for a debut green bond. These findings are statistically significant. As such, we can conclude that indeed, as we have seen by the findings of our ESG investor survey, investors do seem more open to accept a higher greenium if the green bonds refers to the first sustainability offering by a company.
4. The greenium is slightly higher for longer-dated bonds
Another commonly thought speculation by market participants is that green bonds are usually held by investors with long-term focus. That is because green bonds are typically issued to finance environmentally beneficial projects, such as renewable energy, which inherently have long-term horizons. These projects take years, sometimes decades, to fully realize their environmental and financial returns. Furthermore, green bond investors often recognize that climate risks are expected to become more extreme in the long term. As a result, they view green bonds and their issuers as better positioned to navigate these risks. This would imply that there is an intrinsic motivation for investors to prefer longer-dated instruments.
With that in mind, we were interested in testing the hypothesis that the greenium is stronger for green bonds with higher maturities. To investigate that, we added an interaction term to our regression model that captures the relationship between the green bond dummy and the bond’s years to maturity. Our findings indicate that these is a statistically positive relationship between the two. The interaction term has a negative coefficient of -0.2bps, implying that for every additional year, the greenium increases by 0.2bps. That means that green bonds with longer maturities trade with a higher greenium, but the additional amount is nearly negligible.
5. The greenium oscillated over time, but this does not seem to be driven by higher green bond issuance
Some market participants assume that the issuance volume drives the greenium over time. For example, in a year where more green bonds are issued, the additional instruments assist with meeting the rising demand of investors, which in turn allows them to invest in green bonds without having to pay the higher price. The latter implies there would be evidence of a lower greenium when more green bonds are issued. This was for example one of the findings by a previous study conducted by the asset management firm Robeco (see ). Hence, we are also interested in investigating this relationship.
At first, our findings seem to indicate that there is actually a positive relationship between the greenium and the issuance amount. The chart below on the left plots the greenium over time in comparison to absolute levels of green bond issuance in our sample. Indeed, the greenium did reduce over time and that seems to coincide with the years where green issued increased significantly. For example, in 2024, green bond issuance jumped by EUR 15bn while the greenium decreased by 16bps. This relationship is however hard to evaluate in 2025, as issuance still lags the previous year given that it refers to only 10 months issuance, in comparison to 12 months in 2024. As such, we replicated this analysis by investigating the relationship of the greenium with the share of green bond issuance relative to the entire market. However, this is where the relationship becomes hard to explain. In fact, we find counterintuitive results: in years where green bond issuance represented a smaller share of the total market, the greenium increased, and vice-versa. We would expect that the greenium would come down only when there would be more issuance relative to the total market, not less. As such, we conclude that, although the greenium has reduced over time, there is no strong evidence that suggests that the greenium is linked to the total amount issued on a specific year.
6. Higher market volatility has no impact on the greenium
Another common assumption is that the size of the greenium is driven by the market volatility. That is, when markets sell-off, the greenium increases. For example, a study by ICMA analyzed monthly greenium data for the 12-months period preceding August 2020 (). The study showed that there is a material variability in the greenium over that period, coinciding with broader market tumult. As such, they concluded that the greenium increased following a post peak in market sell-off. Presumably, this could be due to green bonds’ lower volatility, which becomes more pronounced during market turbulence, where there is less spread widening for green bond than for non-green bonds, driving the greenium up. Given that, we were interested in evaluating whether this behavior is also witnessed in our sample of daily data points over a longer period of time.
We do this by adding two new variables to our model: the VIX Index (which we use as proxy for market volatility) and an interaction term between green bonds and volatility. We find out that, as expected, the higher the market volatility, the wider the credit spreads, all else equal. The interaction term has a slightly positive coefficient of 0.04bps in our regression, which would indicate that green bonds are slightly more sensitive to volatility. That is, for every 1-unit increase in volatility (VIX), the effect on credit spreads for green bonds is 0.04bps higher than the effect for non-green bonds. However, a 0.04bps impact is an unsignificant amount, implying that we can comfortably conclude that volatility has no impact on the greenium. To add to that, and more importantly, the interaction term is also statistically insignificant.
The chart on the next page on the left illustrate our findings. As it is possible to see, there is no additional impact on green bond spreads vis-à-vis non-green bonds spreads of higher volatility. If there would to be any impact, we would expect both curves to have a different slope. That hypothetical scenario is illustrated on the right-hand chart below. In this scenario, were the interaction term has a manually set coefficient of -4bps, we can clearly see that the greenium (the difference between green bond spreads vs non-green bond spreads) increases with volatility.
It is noteworthy to mention that although we find that both green bonds and non-green bonds react similarly to changes in market volatility, this does not imply that our previous study showing that green bonds exhibit lower volatility is invalid. The latter speaks to the variability of credit spreads, such that green bonds may experience less overall volatility in spreads, regardless of changes in the VIX.
Given the above, what would explain the ICMA findings and the general assumption that volatility impacts the greenium? One potential reason for that is the relationship between credit spreads, coupon and convexity. Depending on investors’ expectation regarding interest rates and spread changes, investors might prefer bonds that offer a higher (or lower) convexity and/or coupon. We elaborated on that on a previous piece (see ). In this piece, we showed that investors tend to prefer low coupon bonds in a stable rates environment, where rolldown returns exceed coupon income, but tend to prefer high coupon bonds if they expect sharp increases in interest rates. The latter is because rising interest rates decrease bond prices, which in turn, can turn rolldown returns negative. In this case, investors might prefer high coupon bonds, which offer a stable, large and positive coupon income, while also allowing investors to reinvest the large coupon payments at the current higher yields, further limiting the negative impact of falling bond prices.
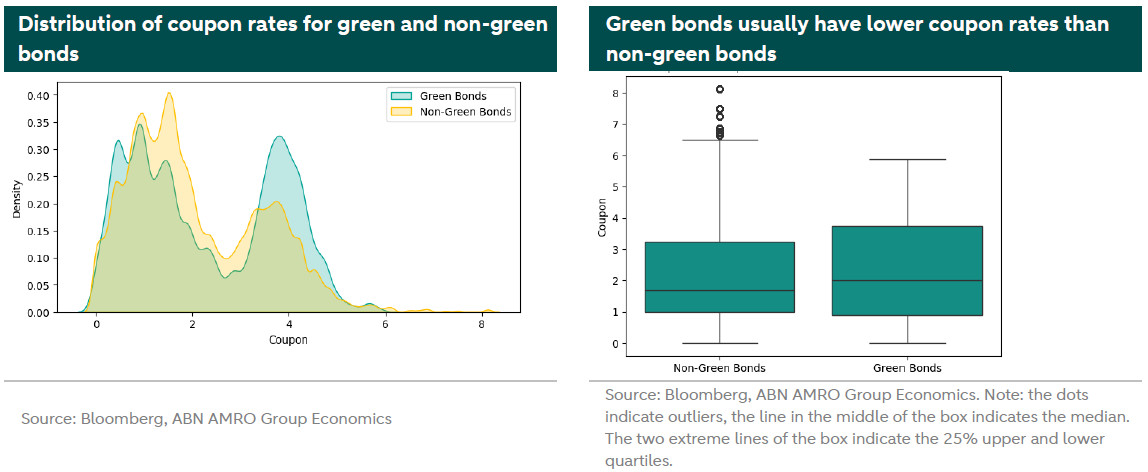
And indeed, as shown in the charts below, the green bonds in our sample tend to have slightly higher coupon bond rates compared to non-green bonds, suggesting a preference for these bonds when investors are expecting sharp increases in interest rates (all else equal). This could help to explain why the greenium has reduced over time (as we discussed in the previous section). On the right-hand chart below we see that median coupon for a green bond is slightly higher than for a non-green bond. Interestingly as well, we notice from the left-hand chart that there seems to be two distinct clusters of coupon buckets for green bonds: one that is around 0.5-1% and the other one that is around 4%. That indicates that green bonds show bimodality – two typical coupon levels, implying that they were heavily issued during two rate regimes: when rates were very low and rates were very high. The size of the box in the right-hand chart also highlights that. All in all, the fact that green bonds in general offer lower coupon rates can be evidence that the higher greenium following periods of market volatility found in the ICMA study was just attributed to investors expecting lower rates and therefore favoring lower coupon bonds (which also tend to have higher convexity).
Conclusion
Literature to explain the behaviour of the greenium is still scarce and heterogeneous. Conclusions vary depending on the market analysed (for example: IG vs HY, euro vs other currencies, etc). In this note, we showed however that for the euro IG market, there seems to be strong evidence that there is still a greenium that reaches an amount of 15bps when daily bond analysing data over the last three years. At the same time, we do find evidence that the greenium is decreasing over time, although we do not attribute that to the higher issuance volume of green bonds. While one could perhaps speculate that this is driven by heightened market volatility, we show that this is not the case. In fact, there is no evidence that the greenium increases with volatility. However, the different characteristic of a green bond in comparison to a non-green bond, such as a typically lower coupon rate, might help explain why some investors mistakenly assume volatility to be the driver of the greenium. Finally, we show that the greenium is higher if it refers to a debut sustainability issuance by that issuer, if it is issued by an issuer that belongs to a high impact sector, such as energy, utilities or real estate, and if it has a higher maturity date. These findings are in line with what the respondents to our ESG investor survey indicate.
Appendix
We note that our regression model does not yield a significant R-square, which is likely explained by the fact that likely spreads are being influenced by other variables rather than rating, sector and years to maturity. However, a low R-square does not impact our coefficient, as we do not foresee the risk of omitted variables that correlate with our green dummy.
All regressions were tested and corrected for multicollinearity and heteroskedasticity.
