From grid ambition to grid reality: Europe’s utility challenge

Europe’s energy transition has entered a grid-delivery phase, with networks now a key constraint on renewable growth and electrification. Utility pressures vary: DSOs face load-driven connection backlogs, TSOs need to reinforce networks for offshore wind, and solar-heavy systems require more storage and flexibility. A grid-stress index is constructed to compare transmission, distribution, market and adequacy pressures across a sample of nine European countries. Germany records the highest grid-stress score, driven by congestion costs, reliability pressures, negative-price hours and substation overload. Faster permitting, anticipatory investment, early equipment procurement and grid-specific skills are essential to turn spending plans into operational capacity. Europe’s competitiveness depends on timely commissioning and lower total system costs - not simply on the amount of grid investment announced.

Introduction
Europe’s electricity networks are becoming the main constraint on renewable growth and electrification. For transmission and distribution system operators (TSOs and DSOs, respectively), utilities, and large electricity users, the challenge is no longer simply the amount of planned grid investment. These parties must also ensure that capital can be financed, equipment can be secured, and assets can be commissioned quickly. Otherwise, connection delays, congestion, and rising system costs may follow.
This article examines how utilities in selected European markets are responding to growing grid pressures and which delivery, operational and regulatory conditions support more effective adaptation. In this article, utilities refers primarily to regulated electricity network companies, including transmission and distribution system operators, that own, operate, maintain and invest in grid infrastructure. Throughout the article, grid and network refer to electricity transmission and distribution infrastructure; expansion means adding capacity or extending coverage, reinforcement means upgrading capacity within the existing network, and replacement means renewing ageing assets.
Our view is that the transition now is centred around grid delivery, with utilities playing the leading role. The strongest outcomes will be in markets where utilities can invest before demand is confirmed and secure scarce equipment early. Utilities must also allocate grid connections efficiently. At the same time, they need to recover prudent costs without making electricity unaffordable or weakening their balance sheets.
Why the grid has become the transition bottleneck
Rapid growth in renewables, industrial electrification, electric vehicles, heat pumps, data centres and electrolysers has increased capacity requirements faster than many networks can expand. For utilities, the result is a larger capital expenditure programme, more difficult prioritisation between replacement and expansion, and greater exposure to connection delays, congestion-management costs and tariff scrutiny.
The shift also changed the utility operating model. More variable generation is now located far from demand. Local eletcirty use can also change rapidly,while power increasingly flows in both directions through distribution networks. Utilities therefore need to invest more in monitoring, automation and digital control. At the same time, the decline in large, synchronised generators reduces the grid’s ability to absorb sudden imbalances between supply and demand. This makes frequency harder to stabilise and increases the need for stability assets and grid-forming technologies.Utiltiies also have limited visibility of resources located behind consumers’meters. This increases the need for better forecasting and contracted flexibility. These requirements raised operating complexity and capital expenditures, but also created opportunities in ancillary services, storage and demand management.
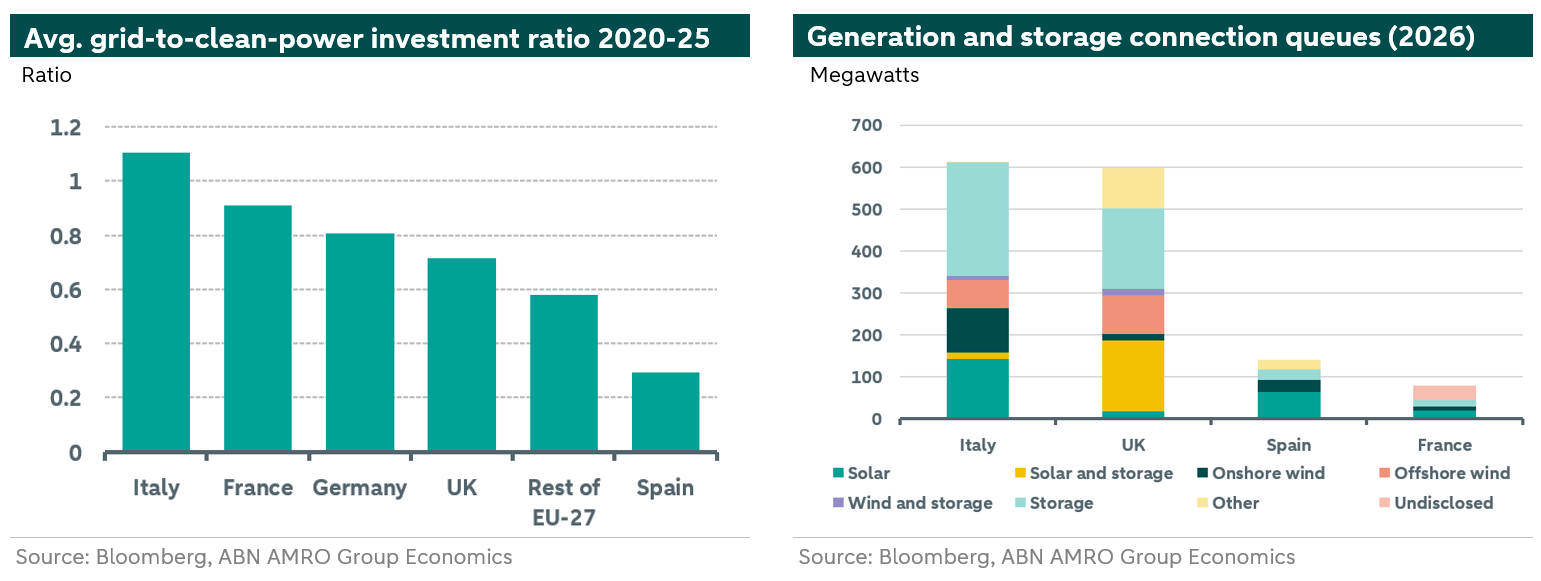
The left-hand chart shows that, in most European countries, investment in electricity grids has lagged behind spending on clean power. Italy is the main exception. The right-hand chart shows that demand for new grid connections is much greater than utilities can currently deliver. Some applications are incomplete, duplicated or unlikely to go ahead. These can take up staff time, make real demand harder to judge and lead utilities to build too much capacity or delay projects that are ready. Utilities therefore need to check whether projects are well developed, have secured land and permits, have financing in place and can meet realistic deadlines, rather than relying on the total queue size alone.
Where the pressure is greatest
Grid stress varies by market and network level. The question is how this stress compares across European economies. The following subsection presents such a comparison by constructing a grid stress index. We then examine four distinct pressures - local load growth, offshore transmission, solar surpluses and connection queues - before assessing how congestion and curtailment translate into utility costs and investment needs.
Comparing grid pressure across markets
Utility risk from grid stress is geographically specific: it may arise from distribution congestion, offshore and inland transmission requirements, renewable surpluses, connection backlogs or curtailment. The matrix below is a comparative screening tool rather than a comprehensive ranking of European grids.
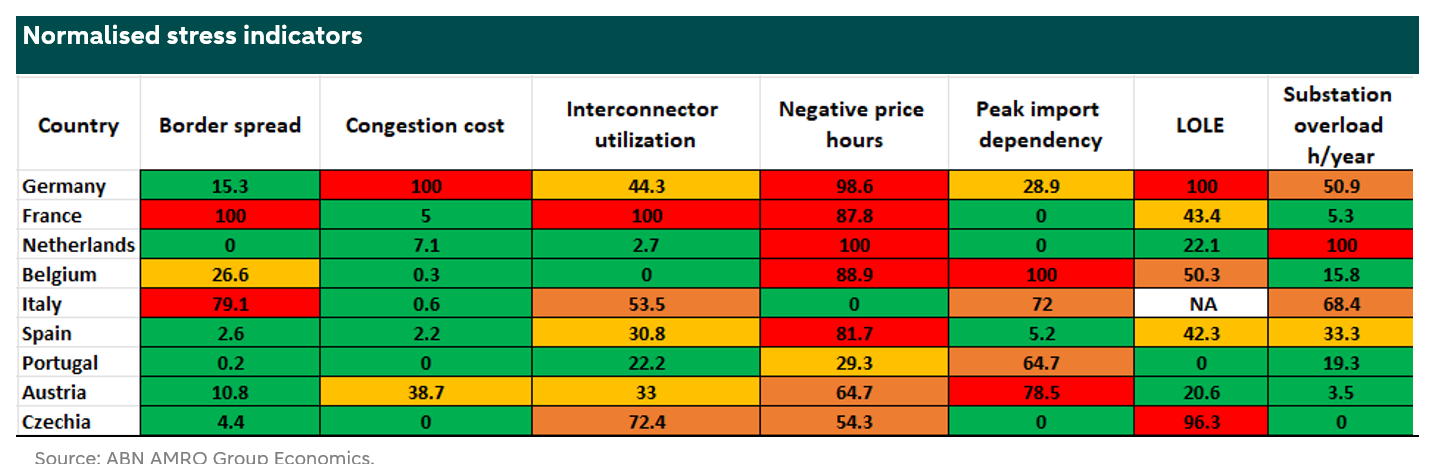
The matrix compares transmission, distribution, market and adequacy pressures across a selected sample of nine continental European economies. The countries provide broad coverage of western, central and southern Europe and represent different types of power systems. Some are large, well-connected markets. Others depend more heavily on electricity imports or have a high share of renewable power. They also face different levels of grid congestion and pressure to maintain a reliable electricity supply. Selection also reflects the availability of sufficiently consistent data across the seven indicators. Findings from this sample should not be generalised to the EU or Europe as a whole. European distribution networks also differ widely in the number of DSOs, the voltage levels they operate, and their planning and reporting practices. The current index captures these structural and institutional differences only partially. Its cross-country results should therefore be interpreted as a standardised comparison of selected indicators, rather than a complete comparison of national distribution networks.
The composite index score uses seven indicators: 1) average border price spreads, 2) congestion-cost intensity, 3) interconnector utilisation, 4) negative-price hours, 5) peak-period import dependency, 6) Loss of Load Expectation (LOLE) and 7) substation overload hours. Together, they provide signals of transmission, market, flexibility, cross-border, adequacy and domestic-network pressure, but none should be read as a single-cause measure. For example, high interconnector utilisation can reflect either efficient trading or limited remaining capacity, while negative prices can be associated with renewable surpluses, inflexible supply, weak demand or network constraints.
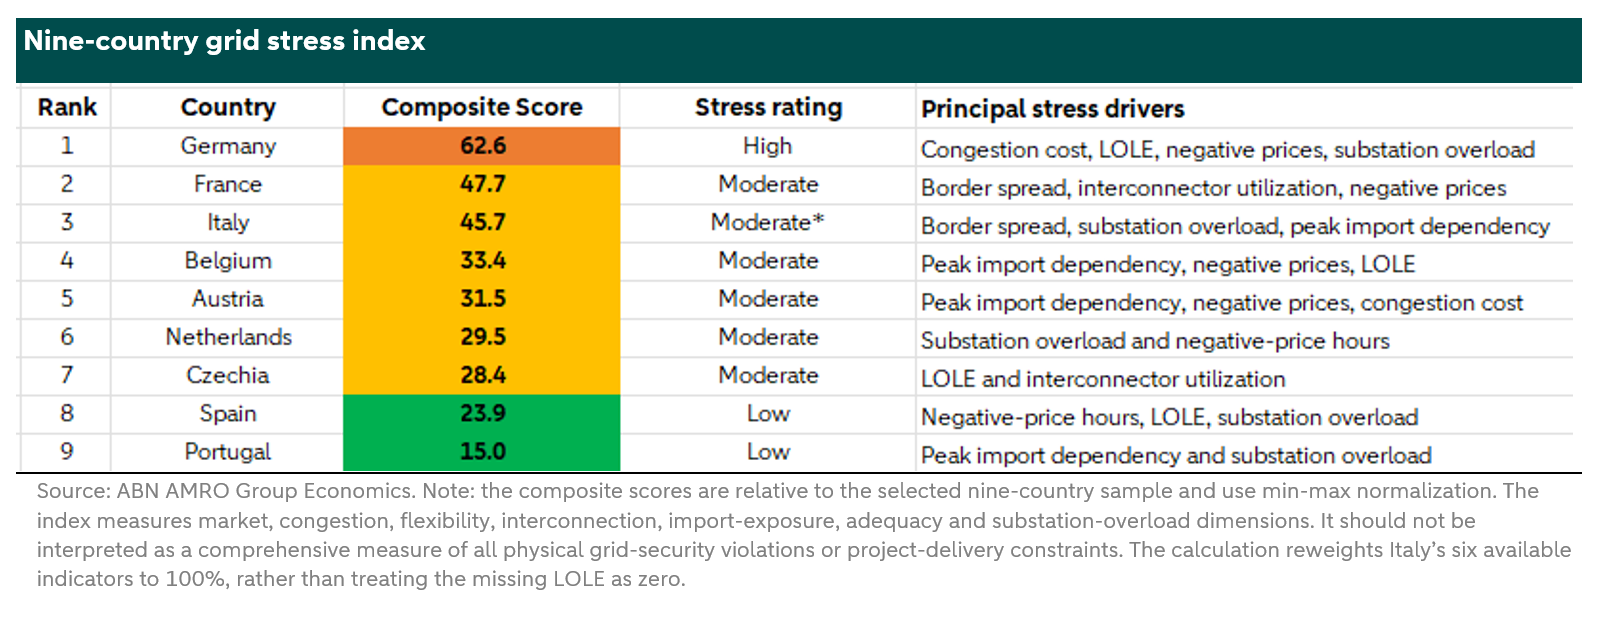
For utilities, a high score suggests more constrained grid with greater potential exposure to redispatch, flexibility requirements, cross-border constraints, adequacy-driven investment or overloaded substations. The index does not fully capture connection queues, every local bottleneck or project-delivery risk. Scores run from 0 to 100 within this nine-country sample; a higher score indicates greater relative pressure, not an absolute level of grid security. The appendix explains the indicators, weights and missing-data treatment.
The final results are presented in the table below. Germany stands out in this nine-country sample. With a score of 62.6, it ranks first and is the only market rated as high stress, reflecting congestion costs, LOLE, negative-price hours and substation overload. France and Italy rank second and third, respectively, and both receive moderate ratings. France’s score is driven by border price spreads, interconnector utilisation and negative prices. Italy’s reflects border price spreads, substation overload and peak-period import dependency. Belgium and Austria sit in the middle of the ranking. Peak-period import dependency and negative prices are important in both markets, alongside LOLE in Belgium and congestion costs in Austria. The Netherlands ranks sixth at 29.5, mainly because of substation overload and negative-price hours, while Czechia follows at 28.4, driven by LOLE and interconnector utilisation. Spain and Portugal are rated as low stress. Nevertheless, Spain still faces pressure from negative-price hours, LOLE and substation overload, while Portugal’s main drivers are peak-period import dependency and substation overload. Lower scores should therefore not be taken to mean that these markets face no significant local constraints or project-delivery risks.
The Netherlands’ relatively low position should not be interpreted as evidence of limited grid congestion. The index captures broad national transmission, market, adequacy and substation pressures, but does not directly measure demand growth, connection queues, waiting times or barriers to grid expansion. Dutch congestion is also concentrated in regional and distribution networks, where severe local constraints may be diluted in a national composite score. Germany scores higher because its pressures are broader, affecting both transmission and distribution networks and appearing across more of the index’s indicators.
The index provides a consistent cross-country screen, whereas the examples below show local delivery risks that a national composite score can obscure. They should therefore be read together: the score indicates where broad system pressure is relatively high within the sample, while the examples identify how the location, technology and timing of constraints affect utilities and customers.
Grid pressure differs with the location and timing of demand and generation. In the Netherlands and parts of Germany, industrial electrification, data centres, electric vehicles and heat pumps are increasing demand faster than local networks can expand. Businesses may be ready to electrify but unable to secure a connection or additional contracted capacity; in the Netherlands, the second Progress Report of the National Grid Congestion Action Programme reported that more than 15,500 companies were waiting in October 2026. For DSOs in the Netherlands, timely expansion is complicated by limited space for substations and cables, raising costs and execution risk, while delays can weaken industrial competitiveness and postpone reductions in energy costs and emissions.
Offshore wind and solar-heavy systems create different pressures. In the North Sea region, large offshore volumes require connections, coastal substations and inland reinforcement to reach industrial and urban demand centres. TenneT plans to invest around EUR 200 billion in the Netherlands and Germany over the next decade, with more than 40% linked to offshore wind connections; project delays can contribute to stranded generation, congestion and redispatch costs, while exposing TSOs to procurement, financing and commissioning risk. In Spain, rapid solar growth is contributing to midday surpluses, negative prices, local congestion and curtailment, followed by a steep evening ramp; these outcomes also depend on demand, interconnection, storage, operational rules and the flexibility of other generation. Accordingly, utilities must coordinate reinforcement with storage, flexible demand and interconnection, while regulators determine when flexibility can reliably substitute for physical assets and how its costs are recovered.
These country examples also help to interpret the stress index. While the index captures congestion costs, negative-price hours and other system pressures, curtailment - the energy that cannot be generated because of network or system constraints - shows one way in which those pressures can translate into operational and financial costs. Depending on market design and compensation arrangements, curtailment may be associated with higher redispatch or compensation payments, weaker generator revenues, pressure on network tariffs and greater regulatory scrutiny. Variation across markets is substantial, but data are not fully available for our sample: in 2025, curtailment rates in Germany and Spain exceeded 4%; France is estimated to have curtailed 1.8% of its variable renewable generation, while the figure for the Netherlands was 1.2%. These outcomes underscore that a country’s composite score should be read alongside the location, technology mix and timing of its constraints.
For utilities, the implication is that queue management, congestion expenditure, flexibility procurement and network reinforcement must be coordinated rather than assessed in isolation. Storage, flexible demand and ancillary services can ease pressure where they are faster and cheaper than reinforcement, while transparent locational signals can steer new projects towards available capacity. Regulators should support timely recovery of prudent flexibility and reinforcement costs, reward reductions in congestion and commissioning delays, and require consistent reporting of queue progress, curtailment and redispatch. Investment appraisal should therefore compare the total system cost of timely reinforcement with the costs of delay - including congestion, redispatch, curtailment, balancing and continued reliance on fossil-fuel backup - rather than focusing only on near-term grid expenditure.
Why grid expansion is hard to deliver
Grid expansion is difficult to deliver because three constraints interact: slow permitting and planning, shortages of equipment and skilled workers, and regulatory frameworks that do not always support investment ahead of confirmed demand.
Permitting and planning
Permitting and planning delays tie up capital before assets enter service or the regulatory asset base. Environmental assessments, land access, local opposition and fragmented approvals can extend grid projects to 4-10 years, compared with 2-3 years for many new generation and demand projects. Utilities then face remobilisation costs, less predictable commissioning schedules and weaker certainty for procurement. Proposed EU measures - including firm deadlines, single national authorities and simpler procedures - could reduce this gap, but implementation remains uneven across states.
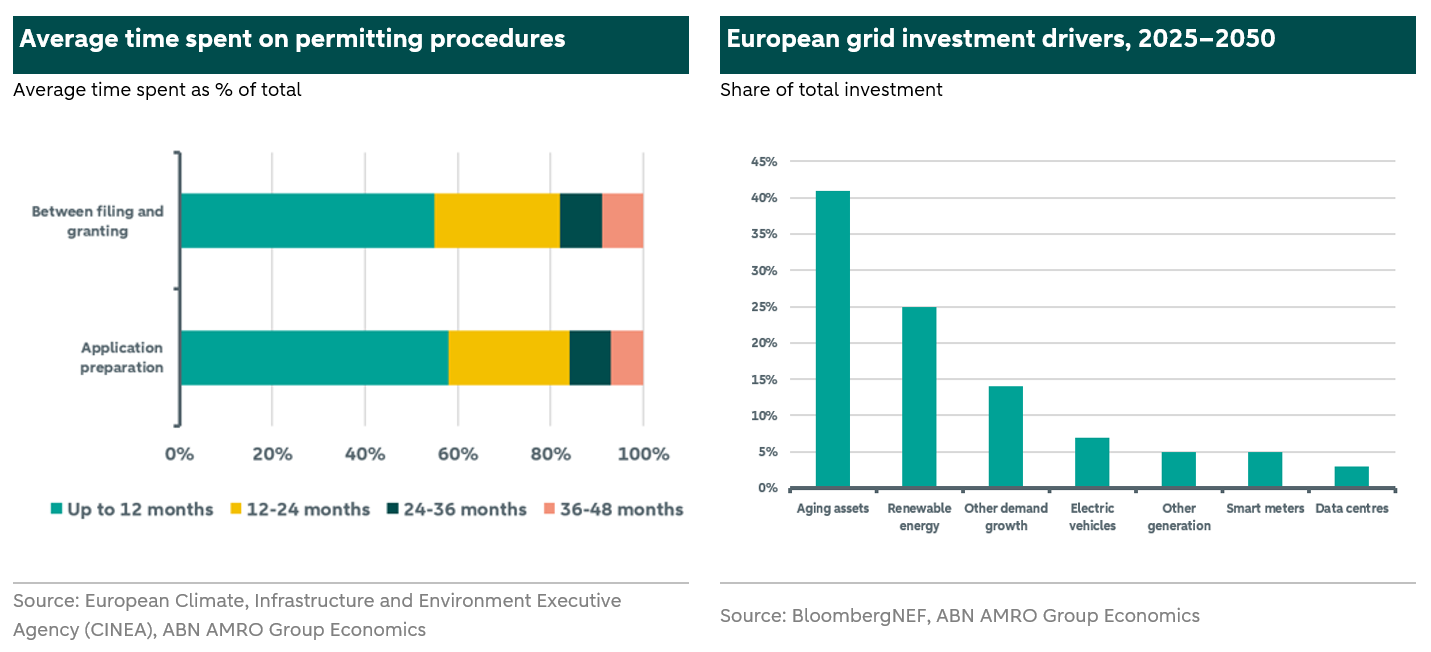
The charts above illustrate both sides of the delivery challenge: approval procedures consume substantial time, while future investment must cover network expansion as well as the replacement and modernisation of ageing grid assets.
Supply chains and skills
Shortages of transformers, high-voltage cables, switchgear, substations and converter stations are increasing prices and lead times. Utilities must compete simultaneously for equipment needed to replace ageing assets, connect renewables and storage, and serve data centres and industrial electrification. Supplier concentration and limited factory capacity make project sequencing and procurement scale increasingly important. At the same time, equipment constraints are compounded by shortages of engineers, technicians and commissioning specialists.
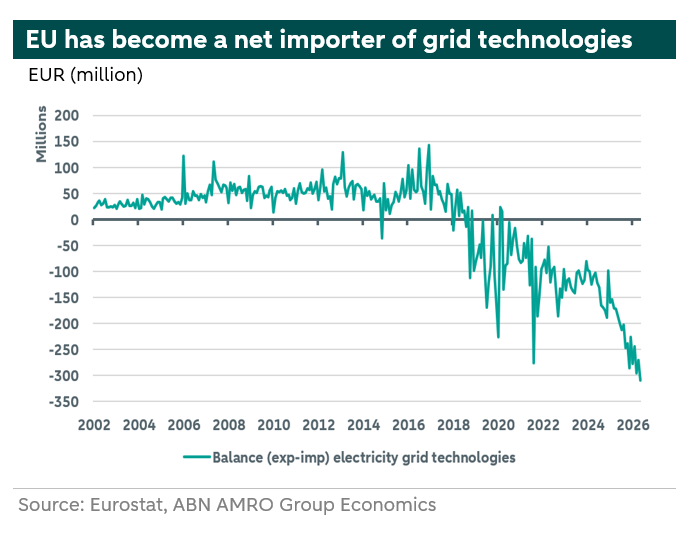
The need to secure equipment quickly and affordably has also increased the EU’s reliance on external suppliers. The EU has been a net importer of grid technologies since 2018 (see the chart below). This import dependence increases exposure to global competition for scarce equipment, exchange-rate movements and delivery delays, reinforcing the case for early procurement and a more resilient European supply base. As a result, utilities are increasingly using framework agreements, advance orders and volume commitments to reserve factory capacity across several projects. This can reduce delivery risk and support supplier expansion, but it creates inventory, cancellation and utilisation risks. Although this raises near-term financial commitments, securing equipment early may be less costly than delays that leave generation or customer projects unable to connect. It may favour larger buyers with credible pipelines, while regulators must decide when prudent early-procurement costs enter the regulated asset base and how much risk consumers should bear.
Regulation and financing
Regulation and financing determine whether utilities can convert investment plans into commissioned capacity. Frameworks need to support anticipatory investment while protecting customers from inefficient or underused assets. Key design choices include allowed profits, inflation and interest-rate indexation, the duration of regulatory settlements, ex-ante versus ex-post cost recognition and the treatment of pre-orders, inventory and construction work in progress.
Large grid expansion programmes can increase debt and equity requirements before revenues arrive, pressuring credit metrics and dividend capacity. Regulatory incentives should therefore reward efficient commissioning, availability, digitalisation and resilience - not expenditure alone - and provide timely recovery of prudent financing costs. Country comparisons should assess allowed returns, tariff effects, financing structures and the share of projects commissioned.
These constraints reinforce one another. Slow approvals delay procurement; late orders raise costs; and uncertain recovery discourages early investment. Faster delivery therefore requires aligned planning, permitting and regulatory decisions, plus transparent allocation of risks among utilities, customers, generators and suppliers. The central regulatory challenge is therefore to enable efficient utilities to finance and recover prudent anticipatory investment before congestion becomes economically binding, while protecting consumers from inefficient or persistently underused assets.
Conclusion
Europe’s energy transition will increasingly be determined by how quickly utilities can convert grid plans into operational capacity. Success requires coordinated permitting, credible connection queues, timely procurement, sufficient skills and regulation that supports prudent investment ahead of demand while protecting affordability. Markets that align these elements will be better placed to reduce congestion, integrate renewables and electrification, protect industrial competitiveness and limit the long-run cost of delay, while delivering faster on the energy transition.
Appendix
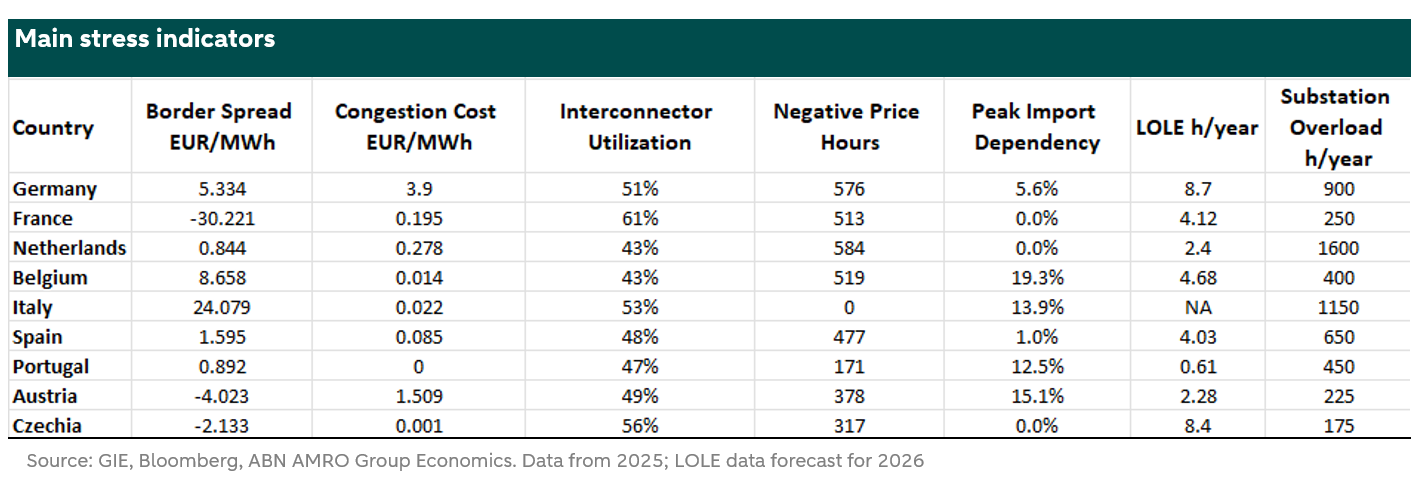
More generally, high interconnector utilisation can indicate efficient trading. However, it can also signal limited remaining capacity. Negative-price hours indicate pressure on flexibility, but they do not directly measure flexibility. Peak-period import exposure should also not be confused with annual import dependency. Substation overload hours add a more direct indication of stress within the domestic network by showing how often substations operate beyond their rated capacity, although they do not capture every local bottleneck, connection delay or reinforcement need. The results are therefore best interpreted as a relative comparison of transmission, distribution, market and adequacy pressures within the selected sample, not as a comprehensive ranking of overall electricity-grid stress.
Each scoring indicator was converted to a 0–100 scale using min–max normalisation across the selected nine-country sample. The weights are an analytical judgement designed to balance congestion, market, flexibility, interconnection, import-exposure, adequacy and domestic-network dimensions; they should not be interpreted as empirically estimated causal effects. The composite score assigns 20% to congestion-cost intensity, 19% to the average border price spread, 15% to substation overload hours, 14% to Loss of Load Expectation (LOLE), 12% to interconnector utilisation, and 10% each to negative-price hours and peak-period import dependency. These seven weights sum to 100%. Where LOLE is unavailable, as for Italy, the six observed indicator weights are rescaled proportionately to sum to 100%, rather than treating the missing value as zero. This preserves Italy in the comparison but reduces direct comparability because its score reflects a different information set. Rankings may also change if indicator weights or extreme observations change; the results should therefore be used as a screening tool and read alongside the underlying indicators and country evidence.