Gas Market Monitor - Gas markets find relief as Europe races to refill storage
Europe’s reliance on LNG has increased since 2022, raising its exposure to global LNG disruptions; the US supplied 58% of European LNG imports in 2025. European gas prices initially surged on the Iran conflict but later eased as Asian demand weakened and US LNG inflows increased. The US-Iran agreement provided further relief, pushing TTF prices around 15% lower, although short term prices remain higher than long term ones. High injection-season prices have discouraged storage filling, leaving EU storage at a seasonal low of 44.7%. Stable Norwegian and US inflows, returning Qatari supply, and weaker Asian competition should allow Europe to reach around 75% storage by October. However, renewed conflict, supply disruptions, adverse weather, or project delays could slow replenishment and keep prices elevated. We expect gas prices to remain above seasonal averages, averaging 46 EUR/MWh in Q2, 43 EUR/MWh in Q3, and around 48 EUR/MWh during the heating season.

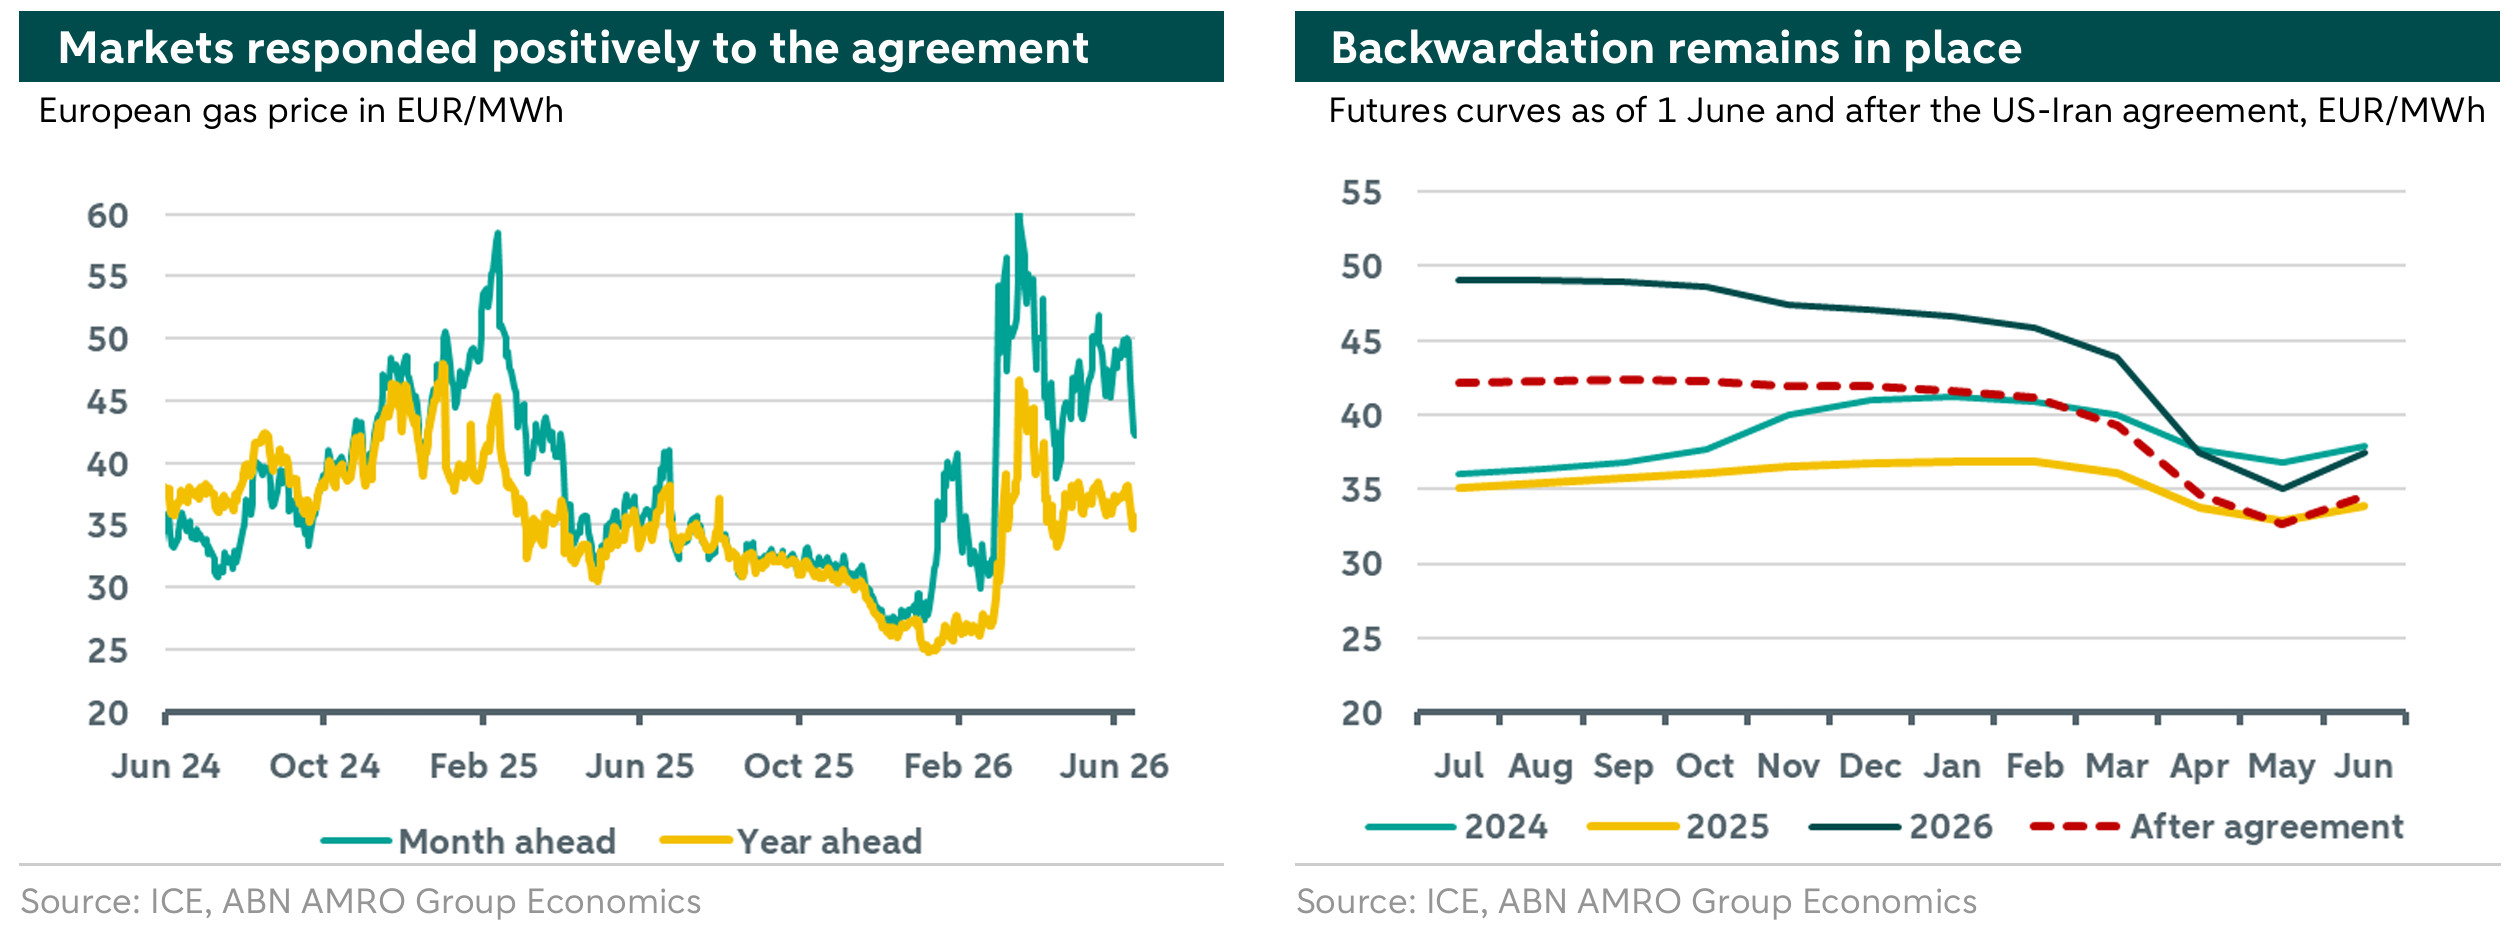
European gas prices initially reacted strongly to the US-Iran conflict, but the impact later eased as Asian demand weakened and LNG imports from the US increased. The subsequent agreement between the US and Iran provided additional relief, with the TTF month-ahead contract falling by around 15% to 42 EUR/MWh. However, seasonally high prices have weighed on storage injections, as the backwardated curve (short term prices higher than long term ones) reduces the incentive to store gas. Even so, current injection rates suggest the EU could reach around 75% storage by October, providing a working buffer for the coming winter, provided supply conditions remain stable.
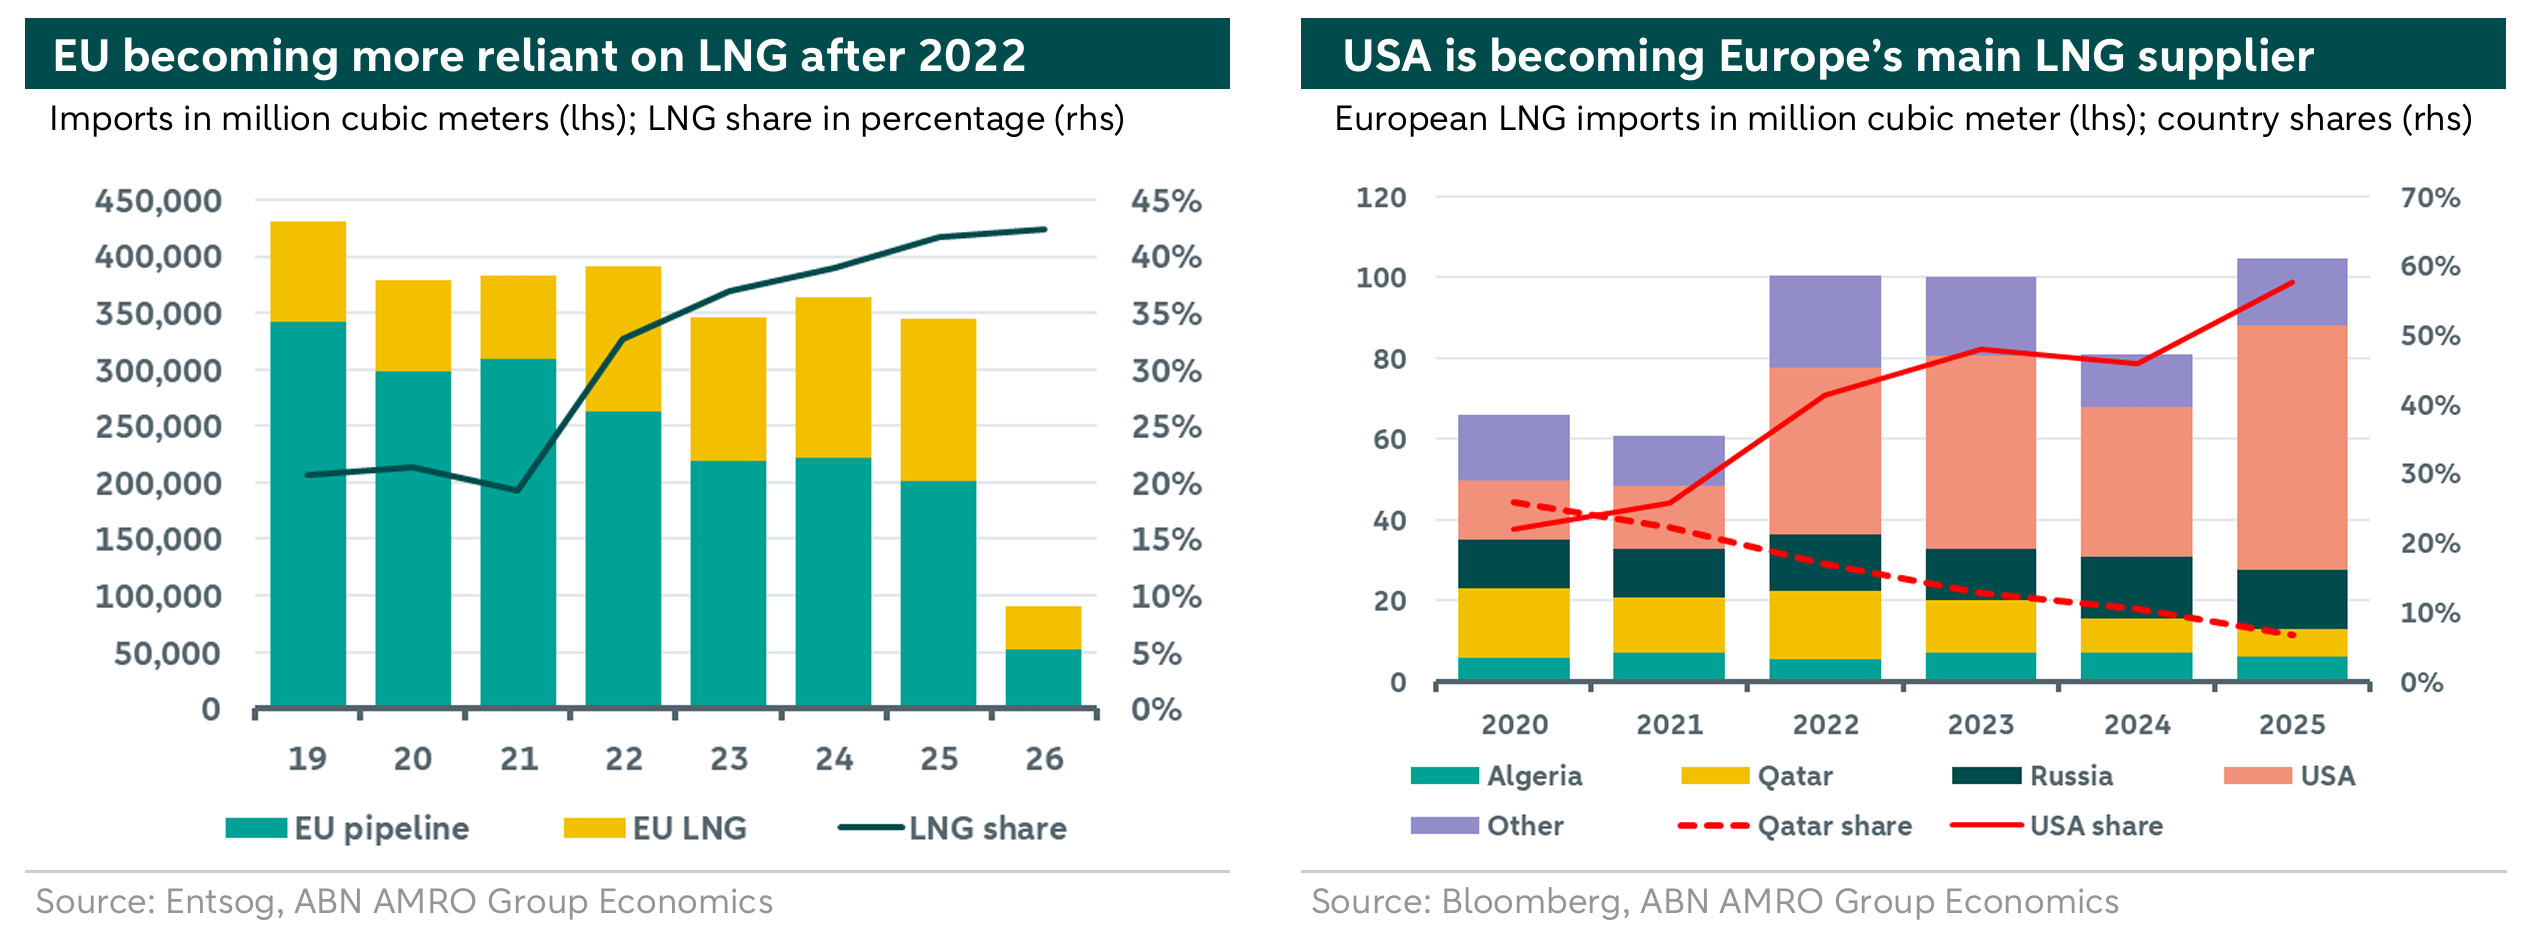
In the aftermath of the 2022 energy crisis, Europe increased its reliance on LNG imports to diversify supply and enhance energy security. However, this shift has also increased its exposure to global LNG shocks. The US has emerged as Europe’s main LNG supplier, accounting for 58% of European LNG imports in 2025, compared with Qatar’s 7% share.
The effective closure of the Strait of Hormuz disrupted around 20% of global LNG flows, primarily affecting Qatari exports. In addition, military operations caused significant damage to gas infrastructure, leaving around 17% of LNG capacity — equivalent to 31 million tonnes — out of service for at least five years, according to QatarEnergy. Although Europe’s direct reliance on Qatari LNG is limited, disruptions to Qatari supply tighten the global LNG balance and increase competition for alternative cargoes.
This shortfall was partially mitigated by higher-than-expected demand destruction in Asia and the commissioning of the "Golden Pass LNG" project in Sabine Pass, Texas. The project has a total nameplate capacity of 15.6 mtpa. Its first train started commercial operations in April 2026, while the second is expected to begin deliveries in June 2026. The third train is scheduled for late 2027, meaning Golden Pass can ease near-term tightness only gradually.
The off-season timing of the conflict also helped temper the price reaction, as demand is typically lower outside the heating season. Even so, European gas prices have fluctuated between 45 and 50 EUR/MWh over the past two months, reflecting persistent market supply uncertainty and elevated volatility. Following the initial agreement to end the US-Iran conflict, markets reacted positively, with TTF futures moving down toward 42 EUR/MWh. However, backwardation remains in place, with near-term prices still above longer-dated contracts and above seasonal averages, as illustrated in the right chart above.
Elevated short-term prices partly reflect the time needed to restart production and restore LNG flows. Restarting upstream production can take up to two months, depending on the field. QatarEnergy expects output to recover to around 50% of capacity within one month after safe passage through the Strait of Hormuz is restored, and to around 80% within two months. In addition, LNG already in storage or transit would still take roughly three weeks to reach Asia and up to six weeks to reach Europe.
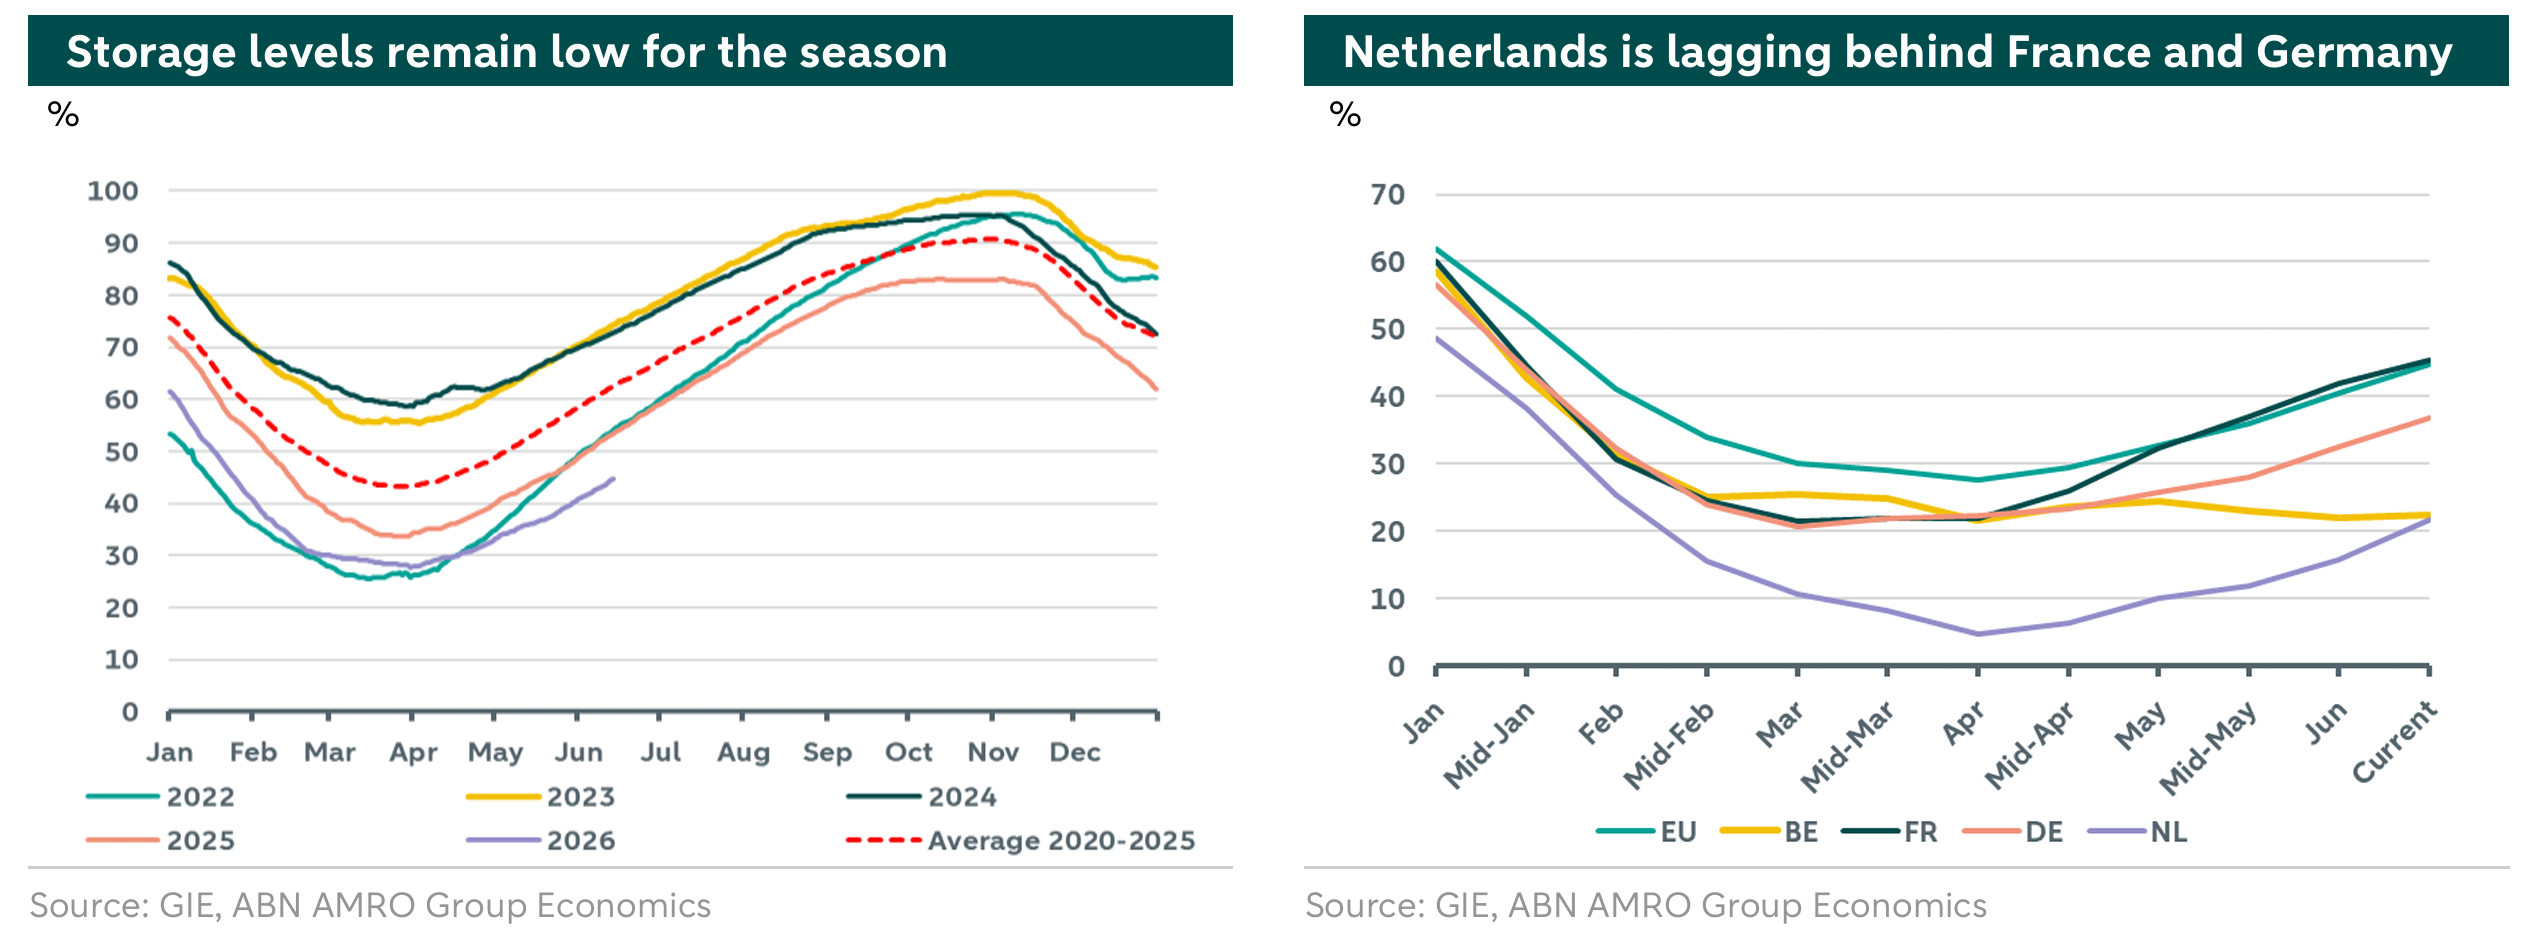
European storage levels remain low for the season. Storage currently stands at 44.7% of capacity, enough to cover around 35 average winter days, compared with a five-year average of 62.4% and 53.4% at the same point last year. Backwardation in the futures curve and the inverted summer-winter spread — where injection-season prices exceed expected withdrawal-season prices — have discouraged storage filling. Traders have been reluctant to inject gas at prevailing prices, as a sudden resolution of the conflict could trigger a sharp price drop and leave them holding expensive inventory that depreciates quickly. This makes the 90% storage target more difficult to reach, although a lower working buffer of around 75% may still be achievable under stable supply conditions. Market incentives are not the only factor; operational constraints, weather-driven demand, and national storage policies can also influence injection rates.
The country-level data show that the Netherlands remains at the lower end of the storage spectrum, with only 21.6% (was 42% in 2025) of capacity filled. However, the Netherlands also ended the winter from an exceptionally low starting point of 4.65% due to higher than usual withdrawal rate. Since then, it has recorded one of the fastest injection rates in the EU.
Storage percentages also mask large differences in technical storage capacity. Belgium, for example, has around 9 TWh of technical storage capacity, compared with 144.3 TWh in the Netherlands, 125.7 TWh in France, and 251.1 TWh in Germany. As a result, the Netherlands and Germany require larger absolute injection volumes to reach their storage targets.
European gas outlook
Looking ahead, the balance between improving supply conditions and still-low storage levels will determine whether prices continue to ease. Europe has avoided the extreme gas price spikes seen during previous crises, but the situation remains delicate as summer progresses. While the current agreement has provided initial relief, uncertainty around its terms and durability remains. Higher cooling demand during warmer months and tight global LNG supply could still put upward pressure on prices.
Under current conditions — stable inflows from Norway and the US, the gradual return of Qatari supply, and reduced competition from Asia — Europe should be able to rebuild storage to a workable level before winter. Current injection rates appear sufficient to reach around 75% by October, assuming favourable weather and no renewed supply disruptions. However, disruptions such as a resurgence of the Iran conflict, unexpected supply shocks from the US or Norway, or adverse weather could slow the injection rate. In such scenarios, policymakers may need to consider measures similar to those used in previous crises, such as coordinated gas purchasing, storage incentives, or temporary regulatory flexibility to accelerate replenishment.
Meanwhile, delays in ramping up Golden Pass LNG, a slower recovery in Qatari output, or unplanned maintenance elsewhere could further tighten global LNG availability and push prices higher. The steep backwardation of the TTF futures curve reflects traders’ concerns about immediate supply constraints.
We therefore expect European gas prices to remain above seasonal averages, averaging 46 EUR/MWh in Q2 and 43 EUR/MWh in Q3. As the heating season approaches, prices are expected to edge higher toward 48 EUR/MWh, reflecting stronger demand and persistent market tightness.