Global industry and trade quite resilient, partly helped by AI boom
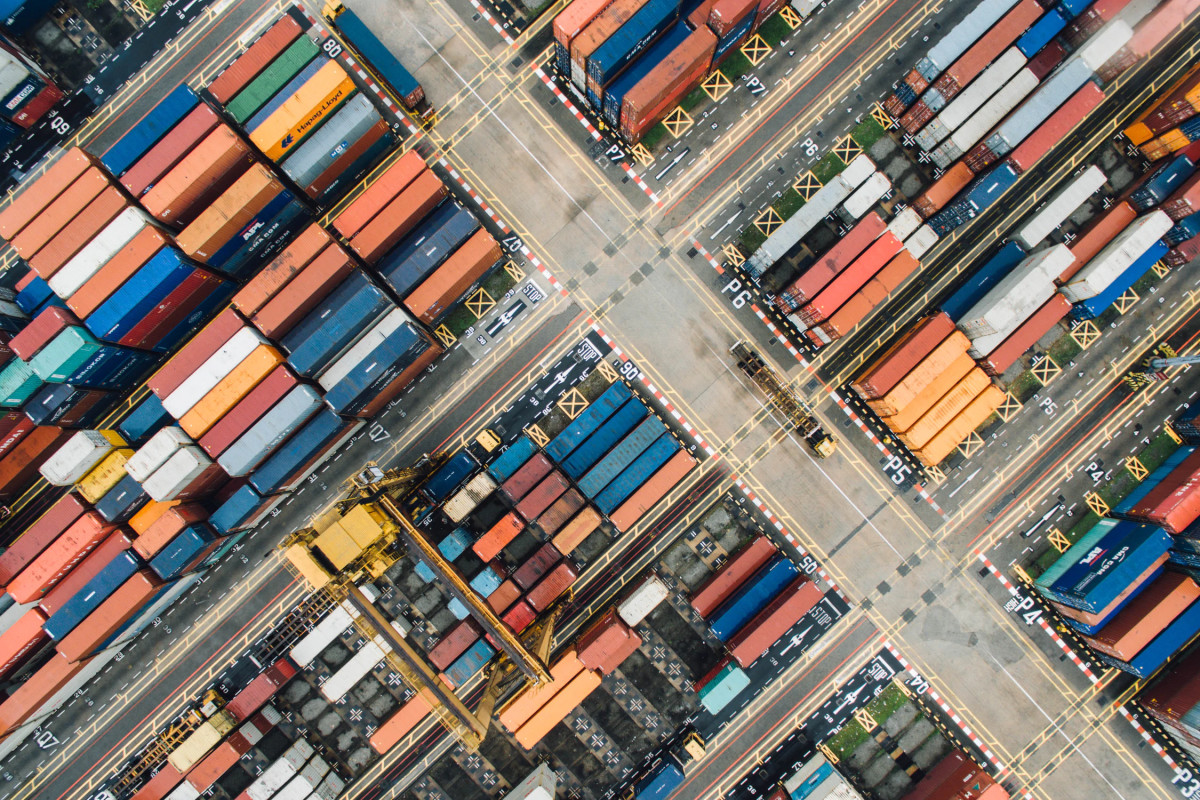
Global manufacturing PMI drops a bit in June, but remains well in expansion mode. Decline in June driven by advanced economies. Global trade accelerated in early 2026, supported by AI boom, slowed during Iran conflict. Delivery times and container tariffs have driven our global supply bottlenecks index higher. Price subindices ease on falling energy prices in June, but stay relatively high for now.

Global manufacturing PMI drops a bit in June, but remains well in expansion mode
The manufacturing PMIs for June indicate that global manufacturing kept expanding in June, although at a slightly lower pace than in May. Despite the reopening of the Strait of Hormuz last month, the global manufacturing PMI dropped to 52.2 in June, 0.5 points lower than the four-year high reached in May. To some extent the drop in June seems to reflect some ‘payback’ from special factors that drove up the global index during the Iran conflict: lengthening delivery times and stockbuilding. Also remarkable in this context is the drop in the future output index to below the long-term trend. Notwithstanding all of this, the fact that the global manufacturing PMI has stayed clearly in expansion territory during the Iran conflict is in line with our base case that the energy shock resulting from the Iran conflict would be more impactful for global inflation than for global growth. In fact, as we explain in our July Global Monthly, Teflon economy shaking off another shock, global GDP growth has shown a remarkable resilience in the face of persistent shocks, supported by a ‘capex troika’ around AI, defence spending and the energy transition; this is also supportive for global manufacturing and trade.
Decline in June driven by advanced economies
The drop in the global manufacturing PMI in June was driven by advanced economies (AE), with the AE aggregate down by 0.7 points to 53.2. Amongst AEs, the sharpest declines were visible for the US and the UK, although their respective manufacturing PMIs stay at relatively high levels. The eurozone’s manufacturing PMI dropped by 0.2 points to 51.4, but corrected for still lengthy – although falling – delivery times would have come out at 50.1, just above the neutral mark separating expansion from contraction. Within the eurozone, the manufacturing PMI for the Netherlands is still relatively strong at 55.5 (see here), Germany (50.3) is still below average, while France showed a pick-up in June. The aggregate index for emerging markets also fell, but more moderately – by 0.2 points, to 51.4 –, with China’s RatingDog PMI dropping slightly (to 51.7) and India’s index falling by 0.8 points but remaining relatively high at 54.2.
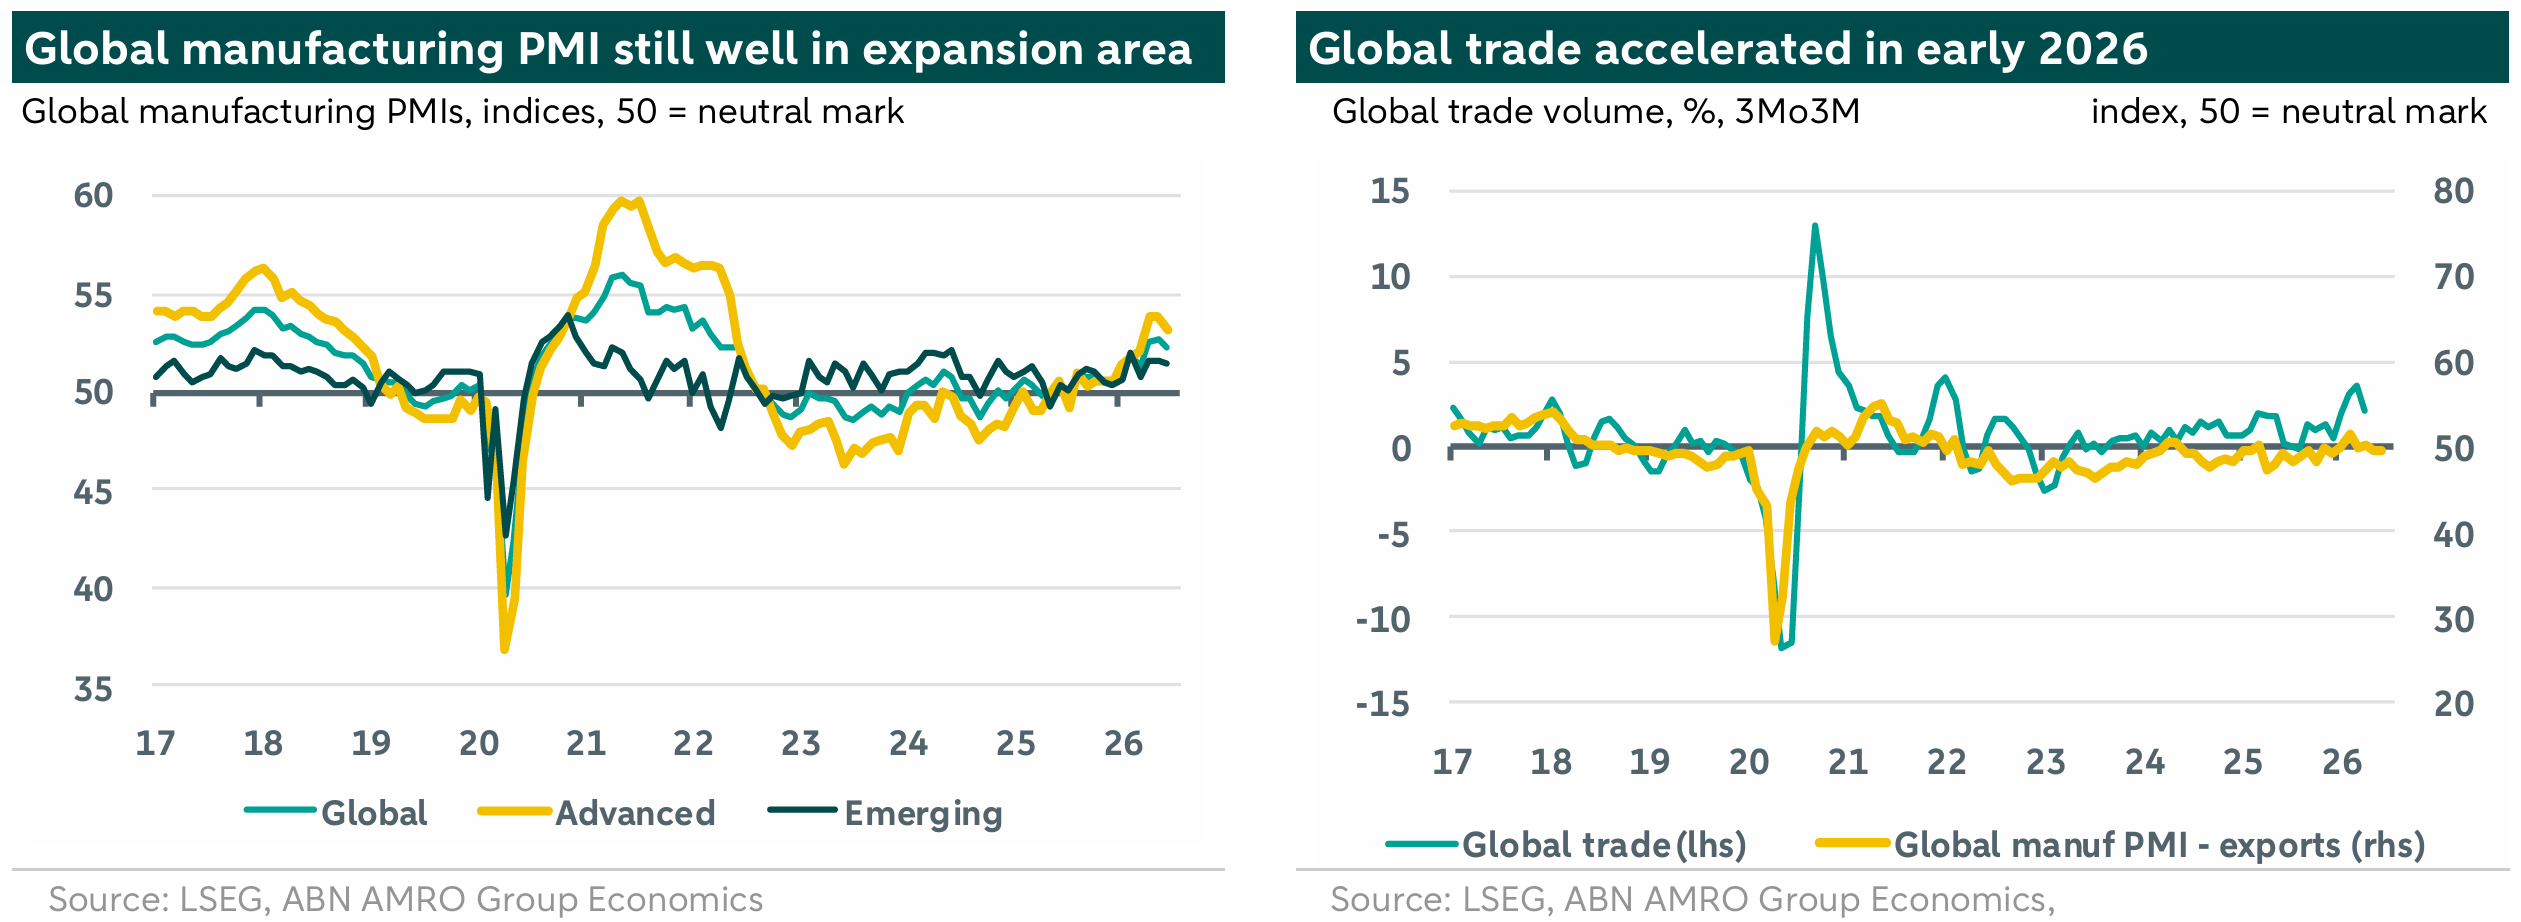
Global trade accelerated in early 2026, supported by AI boom, but slowed during Iran conflict
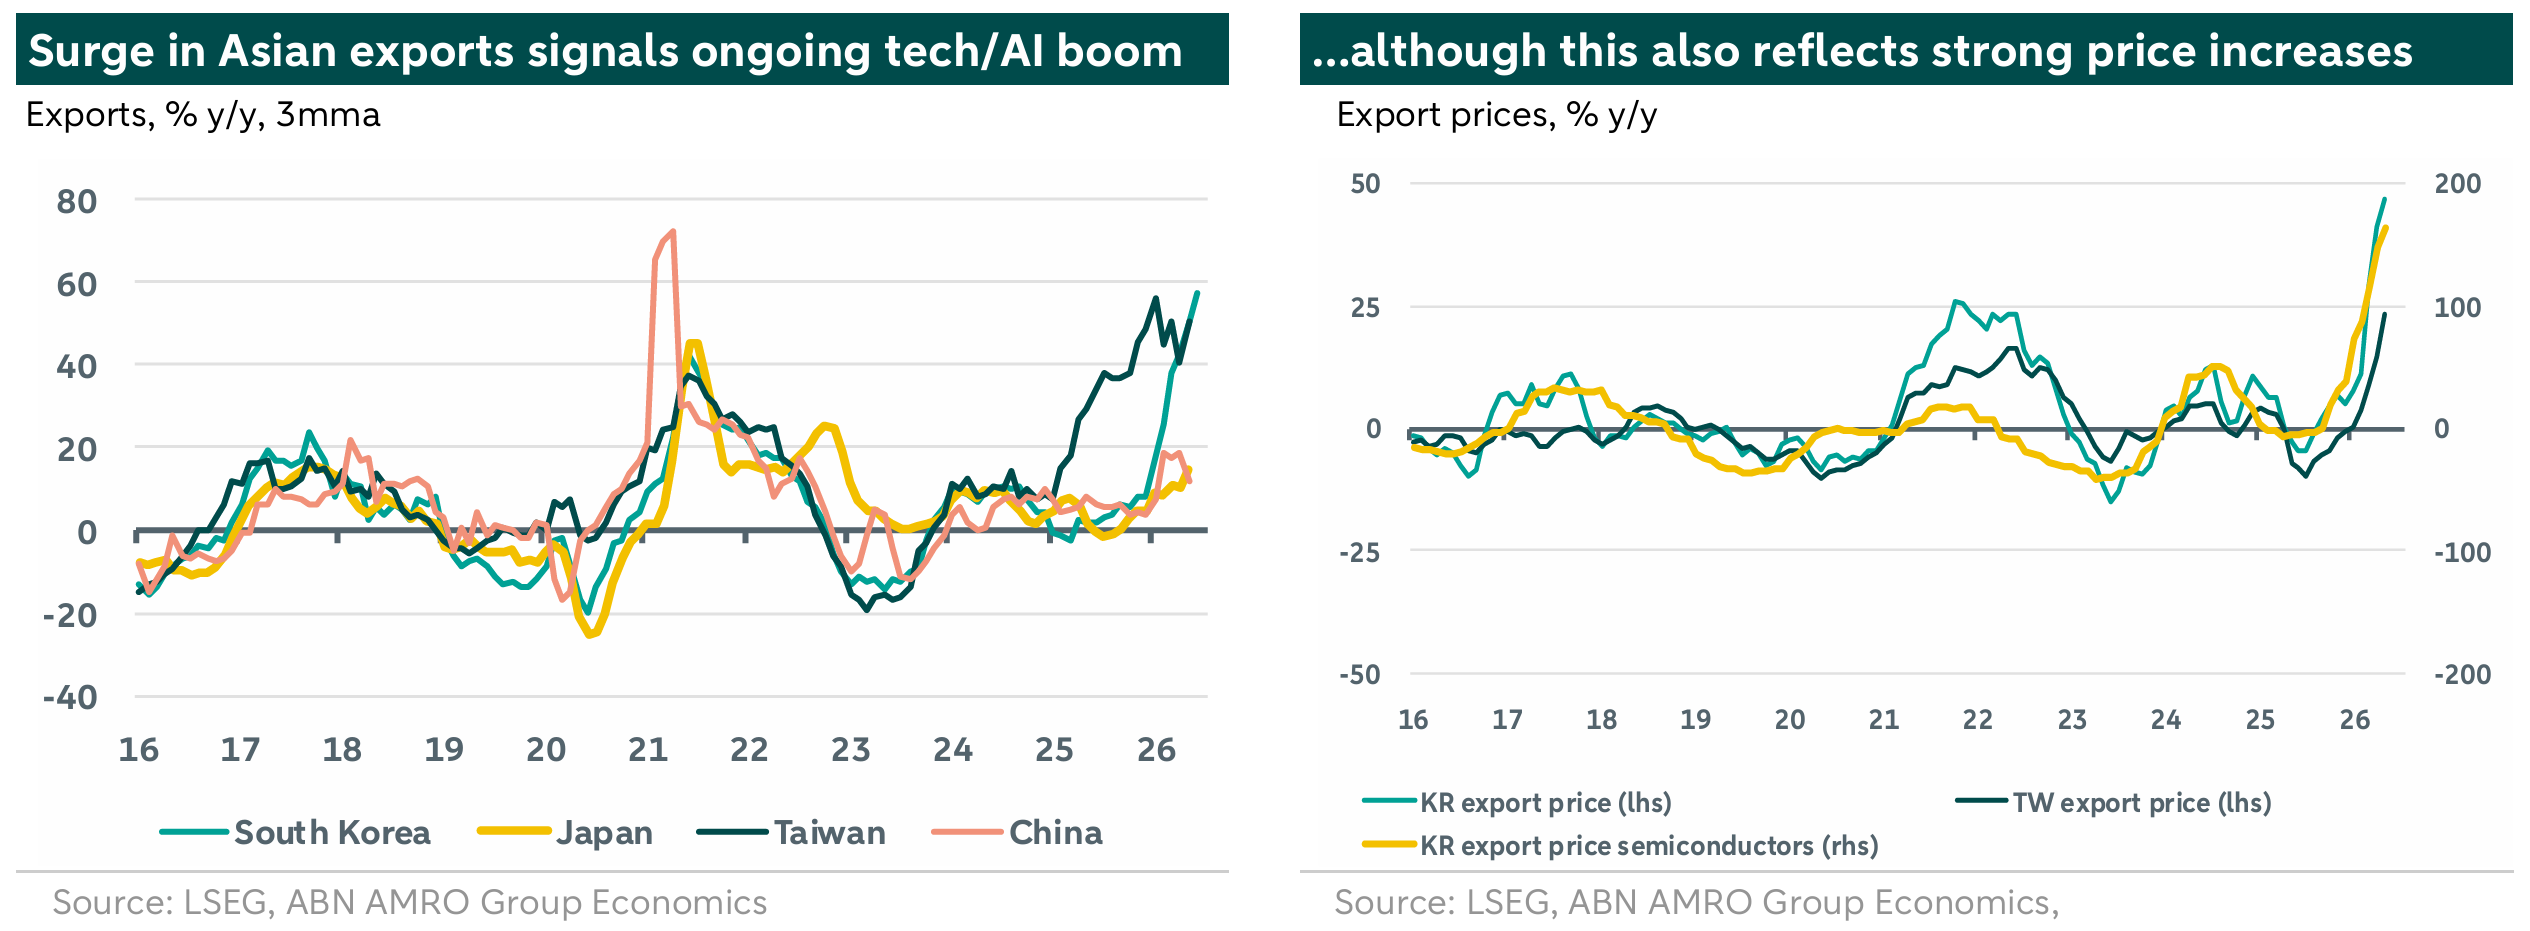
After being remarkably resilient in the ‘Year of the Tariff’ 2025 due to a couple of special factors (see our 2026 Outlook here), global trade growth – measures by CPB’s global trade volume index, currently available until April – also has remained strong in early 2026, although showing quite some volatility. The CPB index rose sharply in January (+3.0% m/m) and February (+1.4% m/m), just before the Iran conflict broke out. In March, the first full month capturing the Iran conflict, the CPB index fell by 2.2% m/m, with some recovery shown in April (+0.7% m/m). As we can see from the chart above, the global manufacturing PMI’s exports subindex has poorly correlated with global (goods) trade volumes over the past few years. Meanwhile, the ongoing global tech/AI (investment) boom led by the US looks to be the key factor explaining the resilience of global trade, despite shocks like US import tariffs and the Iran conflict. As the charts below show, Asian export values (particularly for semiconductor producers like South Korea and Taiwan) are skyrocketing, although this is partly driven by a sharp rise in the price of semiconductors and related goods.
Delivery times and container tariffs have driven our global supply bottlenecks index higher
Meanwhile, the situation in the Middle East/Strait of Hormuz remains fragile, with uncertainty around peace negotiations still elevated (as illustrated by a flare-up of Iran-US tensions and an increase in energy prices over the past few days). Although in our base case we assume the US-Iran deal will stick, disruptions in global supply chains stemming from the Iran conflict will take time to fade out. Our global supply bottlenecks index remained at the highest level in four years in June. This rise has primarily been led by the lengthening of delivery times (March-May), although some easing on this front was visible in June. We should add that this rise in delivery times will not only reflect the (additional) global supply bottlenecks stemming from the Iran conflict, but likely also the ongoing remarkable strength of the global tech/AI capex cycle. More recently, rising container tariffs (May-June) have also been a factor in pushing our index higher: the global container benchmark tariff included in our index has doubled since end-April, although remaining well below the levels seen during the pandemic.
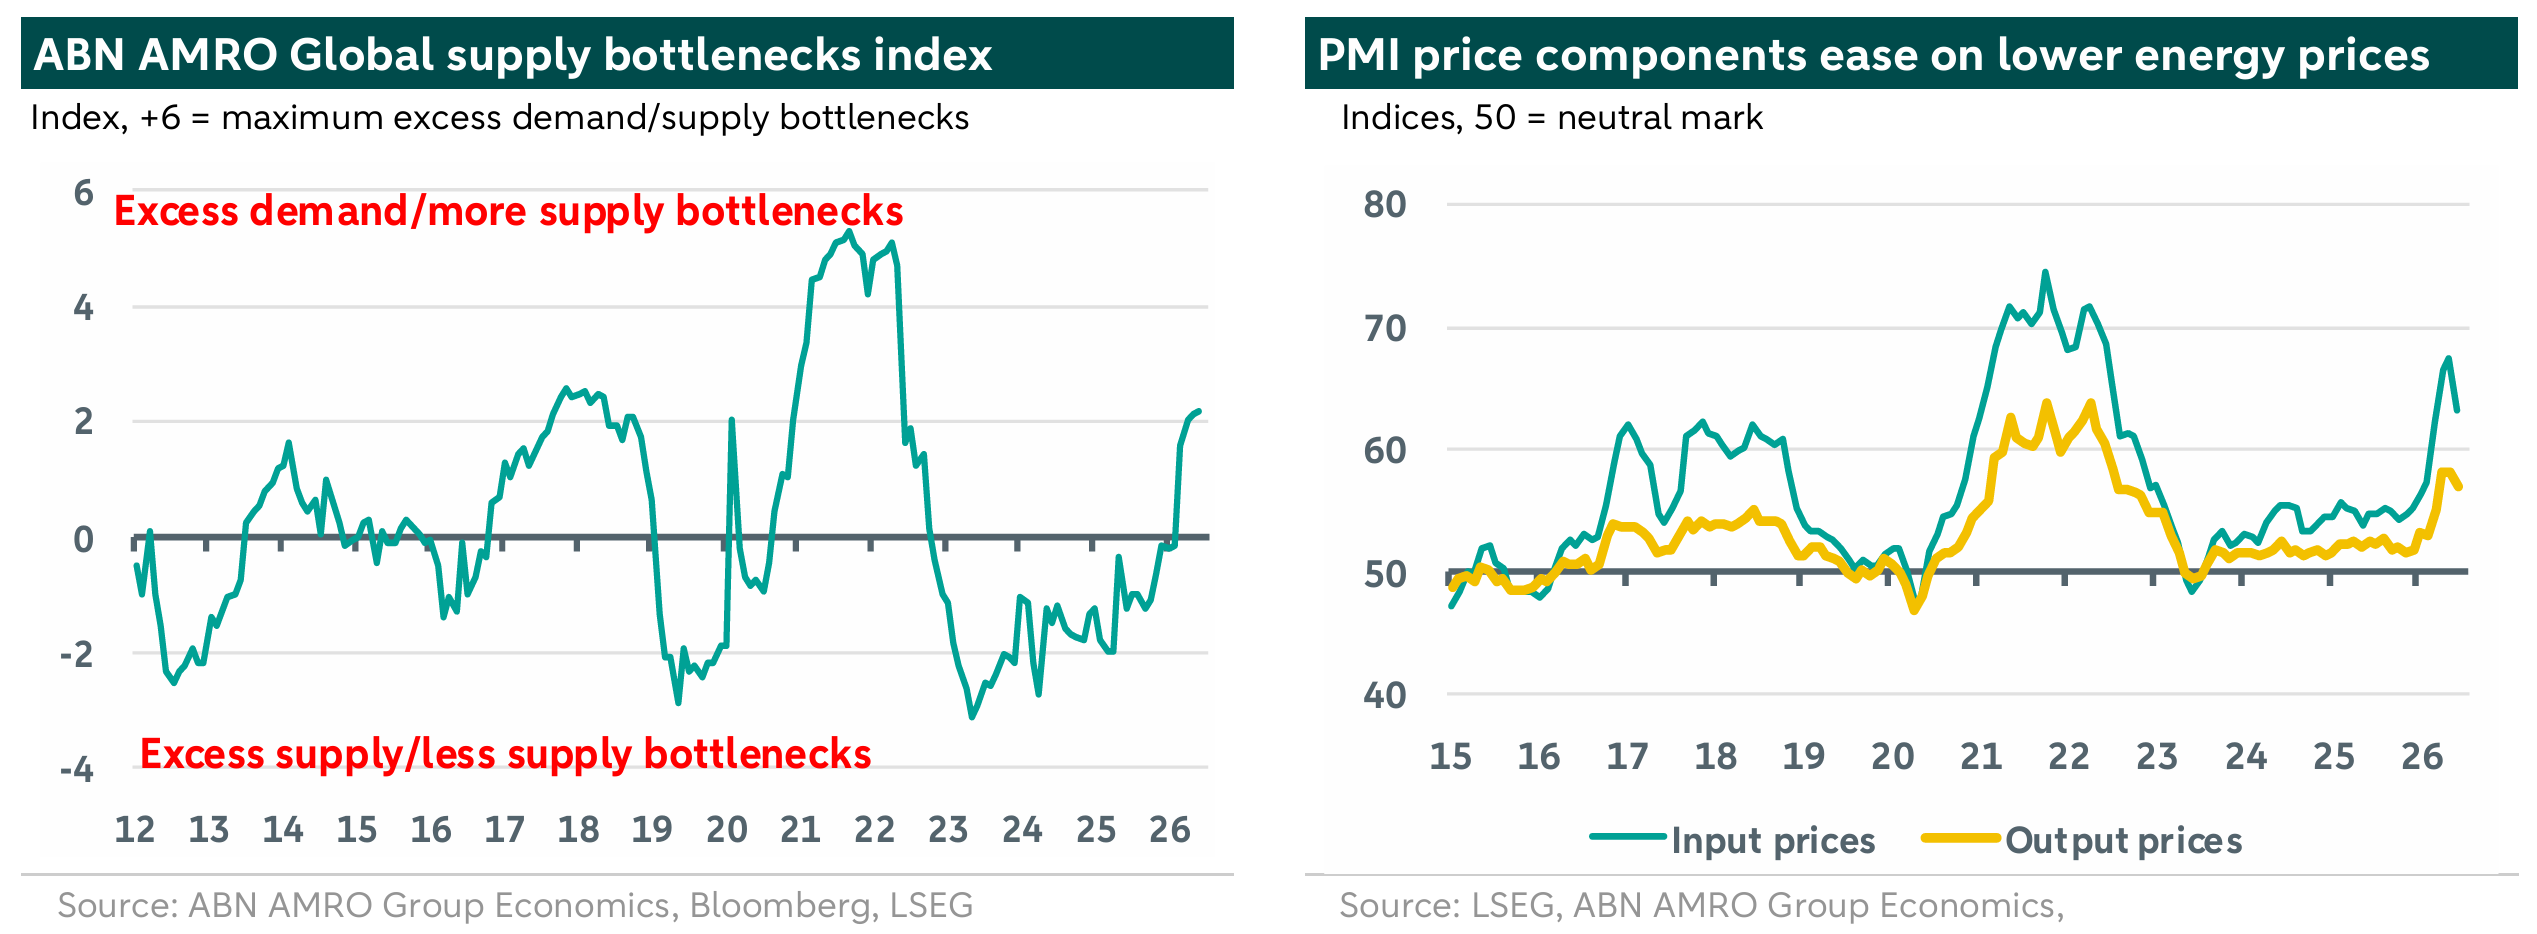
Price subindices ease on falling energy prices, but stay relatively high for now
Meanwhile, the downward correction in energy prices seen in June (although with a recent upward correction due to a re-escalation of Middle East tensions) is likely the main factor behind the easing of the global manufacturing PMI’s subindices for input and output prices last month, although they remain at relatively high levels so far. That said, the pick-up in these components is more an illustration of the breadth of price rises captured by these surveys, rather than a precise measure of their magnitude. Still, as we point out in our July Global Monthly, there are more direct indicators in terms of producer and consumer prices which suggest that the pick-up in global goods inflation likely has a bit further to run.