Housing market monitor - Energy transition

The Dutch housing market must comply with EU energy efficiency regulations by 2030. The Netherlands seems on track to meet the EPBD energy reduction targets, even if there is little room for errors. Improving the worst-performing share of the housing stock remains a challenge, putting the targets at risk. Lower-income households in particular need more support.

Mike Langen
Senior Economist Housing Market
Remark: see download for hyperlinks
The Dutch housing market is undergoing an energy transition
The EU plans an energy transition of the housing market.
The European Union (EU) wants to be energy neutral by 2050, making it the first climate-neutral continent in the world. This means all consumed energy must come from low-carbon or renewable sources, such as wind or solar power. To achieve this, energy consumption must be drastically reduced through efficiency improvements. The construction and housing sector consumes a lot of energy and is one of the biggest CO2 emitters in the EU. The sector is responsible for about 30 percent of global greenhouse gas emissions. These emissions are released during both construction and use of buildings (e.g. heating, cooling and hot water). To achieve climate neutrality, the EU has set energy transition targets for the building sector in the Energy Performance of Buildings Directive (EPBD), a regulatory framework to achieve the decarbonization of residential and commercial buildings by 2050. The EPBD sets binding targets for member states and will be incorporated into national legislation by spring 2026.
The EPBD aims to improve the energy efficiency of (old) buildings.
The EPBD sets clear targets for the housing market, focusing on both new and existing buildings. By setting high building standards, all new homes in the EU must be emission-free by 2030 (Article 7). In addition, existing homes must be retrofitted, especially those with low energy efficiency (Articles 8 and 9). Overall, the average energy consumption of the housing stock must be reduced by 16 percent by 2030 compared to 2020. Five years later, by 2035, the average energy consumption of the stock must be further reduced by 20 percent to 22 percent compared to 2020. After that, the targets will be further increased every five years. More than half of the reduction must be achieved from the 43 percent worst-performing homes, meaning that the reduction cannot be achieved solely by building new, energy efficient homes. Importantly, the energy consumption reduction is based on average primary energy consumption (kWh/m2/year), a theoretical consumption measure estimated by building characteristics.
The Dutch government has outlined its national transition strategy.
While the EPBD sets EU-wide targets, member states are responsible for developing their own national transition plans. The Netherlands has presented its 2022 approach, following the EPBD, focusing on two main areas. First, all new homes must meet the highest energy efficiency standards. Second, the focus is on renovating buildings with the lowest energy efficiency standards. The government aims to renovate 2.5 million homes by 2030, representing 40 percent of the housing stock. These homes are divided into 1 million rental homes and 1.5 million owner-occupied homes. By 2027, homes with energy label G or worse must be renovated to at least label C. By 2030, all homes with energy label F or worse must be renovated to at least label C. Additional targets include the installation of at least 1 million hybrid heat pumps and the expansion of the district heating network. However, most of these targets are not yet legally binding.
In this edition of the Housing Market Monitor, we examine the state of energy transition in the Dutch housing market. Since the formation of the cabinet led by Prime Minister Dick Schoof in 2024, climate-related measures have been on the back burner. Important initiatives, such as the proposed mandatory installation of hybrid heat pumps by 2026, have been scrapped. Other measures, such as the solar net-metering scheme have been taken off the agenda. Despite these national policy changes, the Netherlands remains committed to the EU energy targets. This raises a number of important questions: How is the energy transition progressing in the housing market? What are the main challenges ahead? And what does the current policy trajectory mean for achieving the 2030 climate goals?
Energy transition depends on the housing stock
The EPBD focuses on theoretical consumption, estimated from dwelling characteristics.
The efficiency targets set by the EPBD are based on theoretical consumption of the housing stock, not actual consumption. Thus, it won’t be enough to adopt our energy consumption behavior; the housing stock needs to be upgraded. Theoretical energy consumption is measured in kWh per m2 per year or kWh/m2/year. In more detail, kWh consumption is averaged and the base is primary energy, converting and including all the different energy sources. It is estimated based on property characteristics, such as size and insulation. The same system is used in estimating energy labels. Research shows that theoretical and actual consumption often differ, especially for high and low energy labels. But using theoretical consumption also has the advantage of paying more attention to the quality of the housing stock and not being affected by behavioral shocks or seasonality.
Residential energy consumption has been declining for years but can fluctuate quite a bit.
Figure 1 shows the actual energy consumption of the housing stock in absolute terms and as a share of total Dutch energy consumption.[1] We see that the absolute energy consumption of the housing stock decreases over time. Between 1995 and 2024, the absolute consumption of the housing stock decreased by 32.8 percent, while the housing stock grew by 31.8 percent, indicating strong efficiency gains. Between 2020 (EPBD reference year) and 2024, consumption fell 13.2 percent. Relative consumption to the Dutch total fell by about 5 percent between 1990 and 2024, indicating that the residential housing sector has become more efficient relative to other sectors. However, this is partly caused by the rising relative consumption of other sectors, such as transportation (e.g., more cars). Furthermore, we see strong seasonal influences caused by shocks and mild/strict climate. Coincidentally, energy consumption last peaked in 2020, the reference year of the EPBD, which was probably caused by the lockdown related to Covid-19. Therefore, the drop in actual consumption since 2020 is greater than the drop in theoretical consumption, as required by the EPDM.
The energy transition requires electrification of the housing stock.
When talking about the energy transition of the housing market, it is also important to distinguish between the consumption of electricity and gas (based on fossil fuels). The goal of energy transition is to reduce/eliminate the consumption of fossil fuel-based energy and replace it with (renewable) electricity. This is because electricity can be produced sustainably through wind, solar or other means. Therefore, the EU has simultaneously issued transition guidelines for the energy sector to increase the share of green electricity to almost 100 percent. In addition, new homes are required to be equipped with solar panels so that part of their electricity consumption is covered by own production. Furthermore, electric heating systems are often more energy efficient. This means that they are not only using more sustainable energy, but also less energy on average. Electricity is therefore seen as better than gas. In practice, this is done by assigning a factor, the primary energy factor (PEF), to different energy sources. Because of the PEF, the use of gas outweighs that of electricity. Moreover, self-generated electricity through solar panels is subtracted from the consumption calculation, further reducing theoretical consumption.
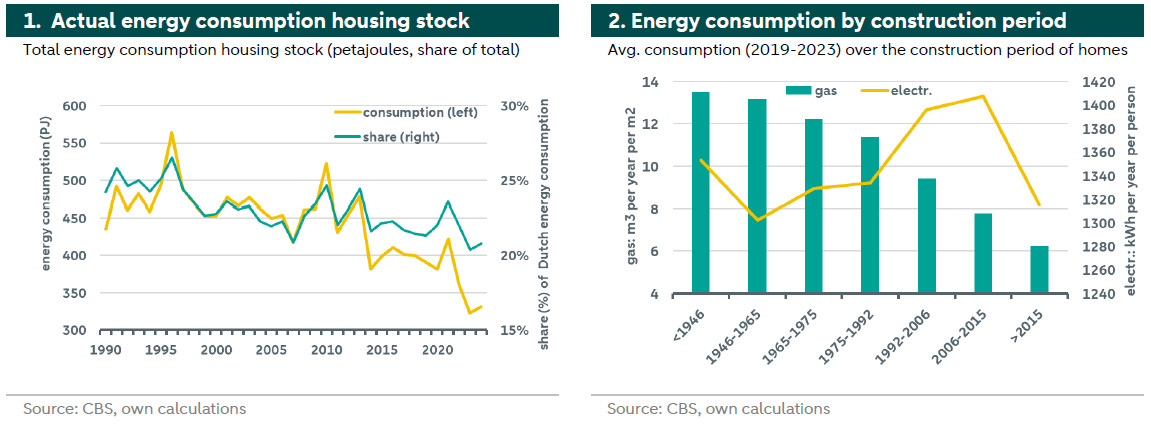
The housing characteristics determine the energy consumption of the housing stock.
In the Netherlands, about 90 percent of all homes are connected to the gas grid, so gas is the main fossil fuel for cooking and especially for heating. Because the required heating energy is determined to a large extend by the property characteristics (e.g., size), gas consumption varies with property characteristics. In contrast, electricity consumption is mainly determined by household size and behavior.[2] The construction year is one of the most important characteristics of homes in this regard, as different materials and insulations were used in different construction periods. Energy efficiency only became important to the housing market after the first oil crisis in 1974. Before, energy efficiency was not a primary concern in housing design. Therefore, average gas consumption per m² has declined since the 1980s. Figure 2 shows the average realized gas and electricity consumption of the housing stock for different construction periods. The average gas consumption of homes has been declining over time, especially since the 1990s. Younger homes use an average of 50 percent less gas than homes from the 1970s or earlier. Modern homes, built as of 2018, are even gas-free. Electricity consumption, on the other hand, varies much less according to the age of the homes.
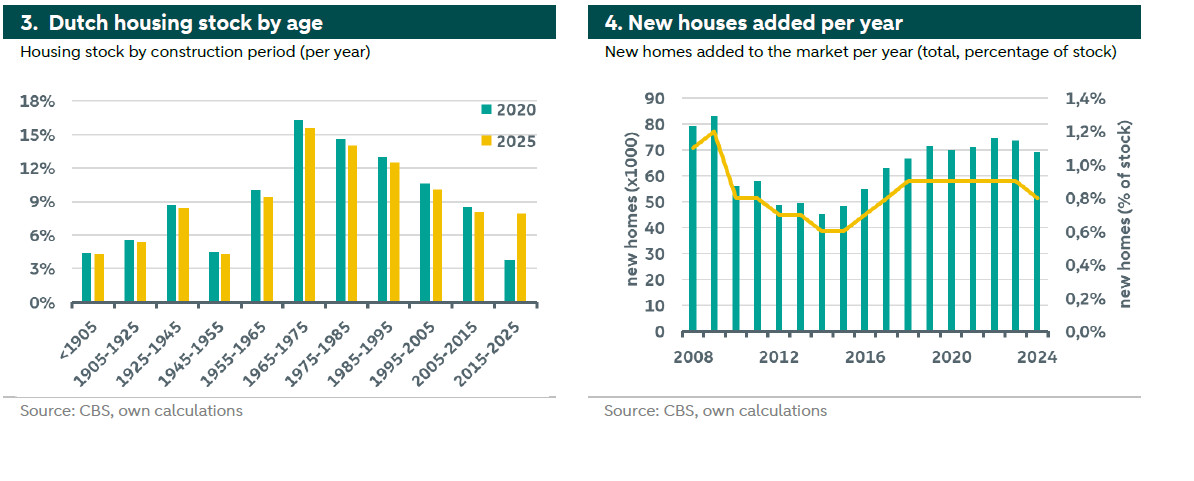
More than 50 percent of the housing stock is potentially not energy efficient.
The energy transition largely depends on the state of the housing stock according to the EPBD measurement method. Figure 3 shows the Dutch housing stock by year of construction for the years 2025 and 2020. Most houses were built between 1965 and 1985, shortly before energy efficiency became important. We see that the stock changes over time as older homes are demolished and new ones are added. In 2020, about 57 percent of all Dutch homes were built before 1980 and thus are potentially not energy efficient. By 2025, this percentage has dropped to 54.4 percent due to natural housing additions and removals. Figure 4 shows the number and proportion of new homes added to the market every year. These homes are highly energy efficient and since 2018 gas-free, improving the average energy consumption over time. Since 2018, the average addition rate per year is about 1% of the stock. If we extrapolate this trend, the share of homes built before 1980 will still exceed 50 percent in 2030. At the same time, the share of new, emission-free homes will be about 5.5 percent.
Policy measures
New building standards and regulations focusing on energy efficiency.
The Netherlands has tightened building regulations in line with EU ambitions. Since mid-2018, all new homes have been built gas-free, and since 2021 they must meet strict, near-energy-neutral standards (BENG). This ensures that expansions of the housing stock are highly efficient, with heat pumps and solar panels, anticipating EU requirements for emission-free new construction in 2030. However, these new rules also increase construction costs and thus lead to higher prices for new homes. Homes that run entirely on electricity also consume more electricity also put additional pressure on the electricity grid, which already suffers from grid congestion. Meanwhile, the government is tackling the worst performing homes: it has announced that homes with the lowest energy labels (E, F or G) will no longer be allowed to be rented out from 2030. Social housing associations had already agreed to phase out such homes by 2028, but the 2030 law applies to all landlords. Financial support is being provided through grants (about €120 million for small landlords) in addition to free loans for low income households (through the Heat Fund) to help finance these renovations.
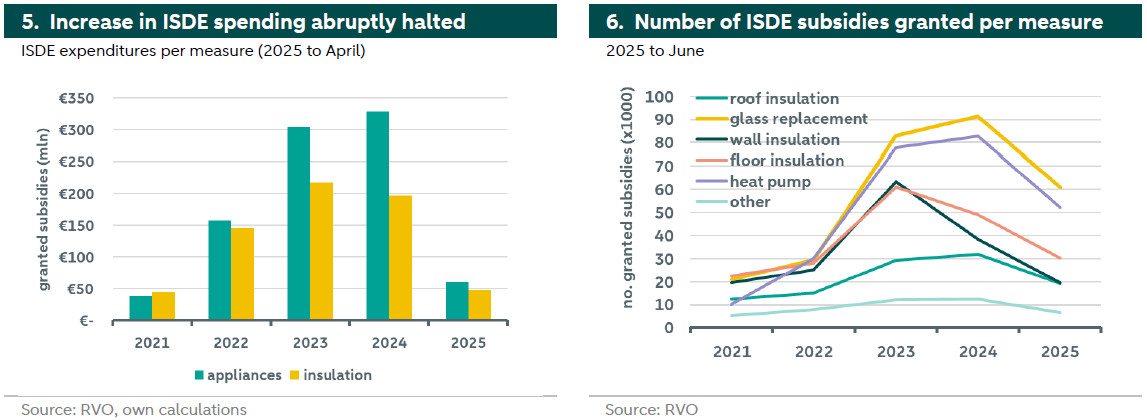
Subsidies for renovations are popular, but it seems that demand has peaked.
Since 2020, the Dutch government has stepped up its incentives for homeowners and landlords to improve energy efficiency. The main scheme is the Investment Subsidy for Renewable Energy and Energy Saving (ISDE), which supports insulation, (hybrid) heat pumps, solar boilers and even connections to district heating. Figure 5 shows the ISDE spending per year per measure (appliances or insulation). We see that in the beginning there was a lot of demand for the subsidy but in 2024 the growth stopped and for insulation subsidies even decreased. If we look at the first 4 months of 2025, it seems that the total will fall again, indicating a decrease in retrofitting activities. Figure 6 shows the number of granted ISDE subsidies per measure. We see that glass replacement and heat pumps are the most requested, followed by floor insulation.
Policy changes lead to less support and may put the EU targets at risk.
Dutch climate policy was modified when the Schoof administration took office in late 2024. An earlier plan to make hybrid heat pumps mandatory as of 2026 when replacing gas boilers was reversed by the new cabinet. The rule would have significantly accelerated the electrification of heating systems but its withdrawal reflected concerns about initial costs and feasibility. At the same time, the government changed the policy on subsidies for solar panels. The popular net-metering scheme, under which homeowners could offset the solar energy they generated against their electricity consumption, was originally to be phased out starting in 2025. Instead, the current plan is to completely abolish the net-metering scheme on Jan. 1, 2027. This may jeopardize the achievement of EU targets, as it creates more uncertainty for households' financial planning.
The heat grid could be the solution, but it is not clear who pays for the investment.
An important pillar of the Dutch strategy is the expansion of the heat grid, especially in urban areas. Heat grids can use industrial residual heat, geothermal energy or biomass, reducing CO₂ emissions and putting less strain on the electricity grid. By 2024, about half a million households will be connected to collective heat networks. The government's heat program calls for this number to double to 1 million by 2030. To enable this growth, a new Heat Act (Collective Heat Act) will be introduced to give municipalities more powers and guarantee fair prices. The law will require heat companies to be majority owned by local governments and decouple heat tariffs from volatile gas prices. However, expanding the heat grid involves high initial infrastructure costs, and while it offers significant benefits, the question remains of who pays the cost of initial connections. Analyses show that large-scale collective heating can be cheaper for society than millions of individual heat pumps. But connection costs can quickly add up to several thousand euros. The government is therefore investigating subsidies and possibly price caps to keep the heat grid attractive .
The efficiency target is achievable, but it requires effort
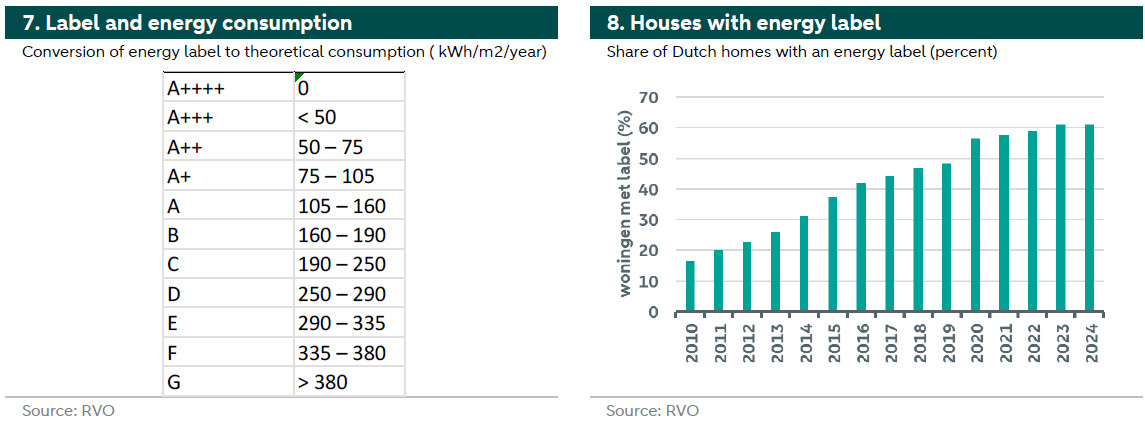
Energy labels as a measure of the energy efficiency of the housing stock.
To assess the feasibility of the energy transition of the Dutch housing stock, we model the distribution of energy labels over time. The Dutch energy label is based on a similar methodology as the consumption estimate of the EPBD, calculating theoretical consumption in kWh/m2/year. Based on the result, homes are given an energy label. Figure 7 shows the translation from consumption to energy label. Energy labels allow us to estimate the average kWh/m2/year, since this measure is not tracked. The disadvantage is that this method only gives a range, since each label has a consumption range.[3] Moreover, not all homes in the Netherlands have an energy label. Figure 8 shows the share of homes with an energy label. Although the share is increasing, in 2024 only about 60 percent of homes (about 5 million) had an energy label. Since a label is only mandatory when selling or renting out, we can assume that rental homes are overrepresented, while owner-occupied homes that have not been for sale for a long time are underrepresented. However, we see no reason to assume that energy labels of the unknown part of the market are systematically different from those of the known share.
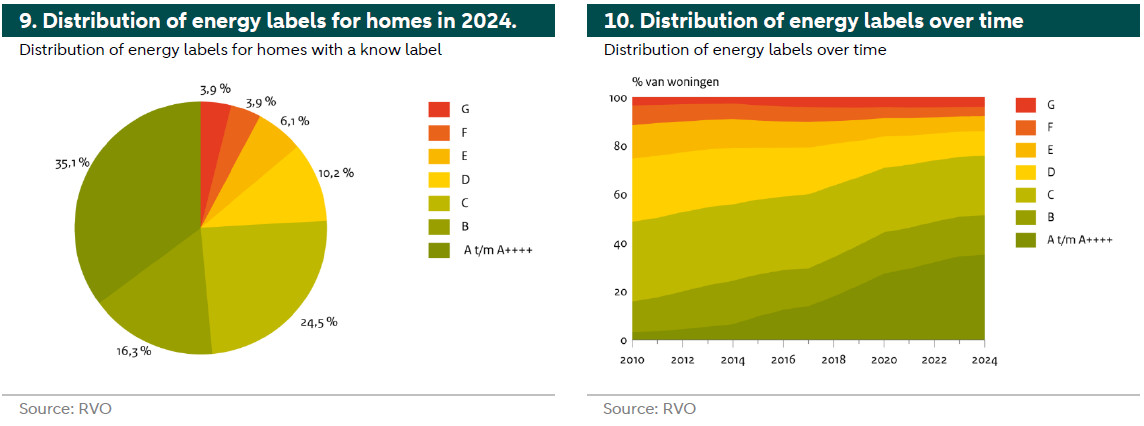
The Dutch housing market is generally energy efficient.
Figure 9 shows the distribution of energy labels for homes with a known energy label in 2024. Most homes (35.1 percent) have label A or better, while 24.5 percent have energy label C. If we multiply the share of homes by the median kWh/m2/year for each label, the weighted average consumption in 2024 ranges from 144 to 229 kWh/m2/year, with a median of 186 kWh/m2/year, roughly equivalent to a label B. Figure 10 shows the distribution of energy labels over time. We see that particularly the share of good energy labels (A or higher) is growing the most, while the share of label D homes is falling the most. This probably has to do with the fact that it is cheaper to go up with initially better labels. So retrofitting from label C to A is often cheaper than retrofitting from label E to C. Another reason for the positive trend is that many solar panels have been installed in recent years. The capacity of solar panels is subtracted from the theoretical consumption of a home, improving the label. In recent years, however, growth has been declining. The exact reasons for this trend are unclear, but it is likely that large waves of renovations of rental properties, which have now been completed, are playing a role.
At the current rate of change the Netherlands will meet most of the EPBD targets.
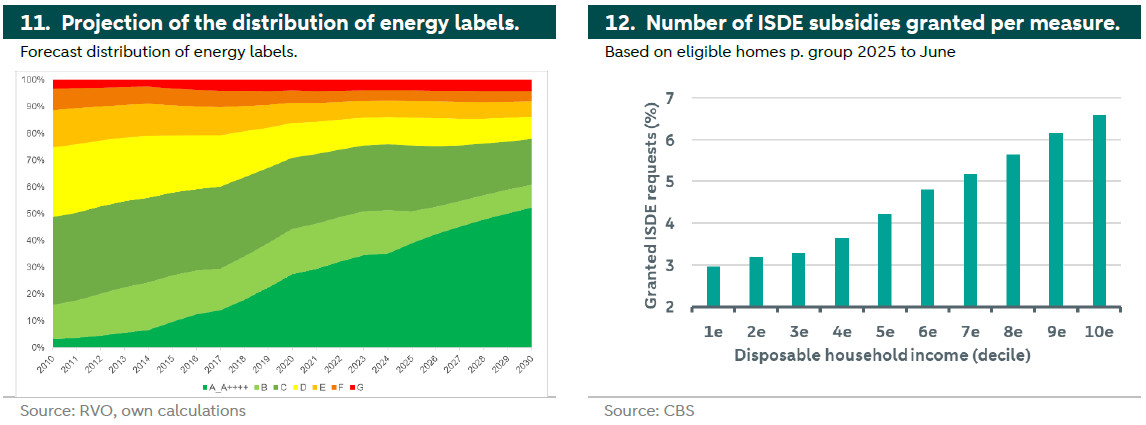
To see how energy labels will be distributed in the future and thus what the theoretical average consumption might be, we use a Markov Chain model. We model how the labels will be distributed in the future, based on how historic growth. We control for factors mentioned here above, such as the number of new homes per year, which are labeled A+++ or higher.[4] We estimate three scenarios: the base scenario uses median consumption, negative scenario uses maximum consumption and positive scenario uses minimum consumption. For 2020, the reference year of the EPBD, we estimated a base consumption of 200 kWh/m2/year. For 2024, the median consumption is estimated at 186 kWh/m2/year, representing a 7.1 percent improvement. Figure 11 shows the base distribution forecast for each year until 2030, indicating that the share of label A or better will continue to increase over time. Based on the model, the estimated consumption in the base case in 2030 to be 164 kWh/m2/year, a 17.8 percent improvement compared to 2020. This shows that the EPBD target of 16 percent is met.
We believe that people will continue to retrofit their homes and that many have "secretly" already done so.
In our positive scenario, the growth is 31 percent and in our negative scenario only 9 percent, which means that the EPBD targets are not met. So what is different in the different scenarios? In our base scenario, we assume that improvements will follow the average trend of the past three years. We think this is realistic, despite recent policy changes. Even though demand for heat pumps and solar panels has fallen, supply remains high, among other due to long production cycles. Together with technological improvements, this is driving down prices in the market. We assume this will encourage more price-conscious owners to retrofit their homes. Another effect comes from the fact that many owners do not update their label after retrofitting but only when they sell. As a result, a large proportion of homes can and will get a better energy label simply by having their home re-inspected (e.g., when they sell). In the negative and positive scenario, we are a bit more pessimistic and optimistic, among other about the potential course of the new government and whether they are going to succeed in building more homes (quickly).
One problem is the retrofitting of the worst-performing homes.
Part of the Dutch targets are that homes currently labeled F or G should be retrofitted to at least label C or better. But according to our model, this will not happen. The number of homes with an F or G label is small, but remains fairly constant over time in all scenarios. This is because these homes often require many technical upgrades, making retrofitting difficult or/and too expensive to be economically viable. Another problem is that these homes are more often occupied by households with lower incomes and less knowledge about subsidies. Based on 2023 ISDE data, we can see the number of applications compared to the number of eligible homes. Figure 12 shows the share of granted applications based on eligible homes by income group. We see that people with higher incomes are more likely to receive subsidies, probably because they are more likely to apply for subsidies in the first place.[5] If the government doesn’t want to risk the EPBD targets, it needs to do more to help lower income households.
[1] For the Dutch total, we exclude energy converted into products (e.g., oil into plastic). This makes for a fairer comparison.
[2] Given the electrification of the housing market, this will change in the future. Electricity consumption will become more fixed.
[3] For label G, there is no maximum indicated. We test different values here, but the effect on the result is not significant.
[4] We look at the average growth of labels over three years.
[5] The application process itself is simple and only requires sending an invoice with some standard information. Therefore, we do not think that the quality of the applications makes the big difference.