Housing market monitor - EU housing markets share common problems

We see housing affordability problems in many EU countries. We therefore look at housing demand, supply and affordability in the EU. It is often assumed that population growth and housing shortage lead to rising house prices, but income growth and falling mortgage rates have a greater impact. Over the past 20 years, Dutch house prices have increased and affordability has deteriorated, but not exceptionally in an EU context. We estimate affordability for homebuyers and conclude that the Netherlands is one of the more affordable buying markets in the EU. With an average income, couples can still buy a house, while single households struggle. Arrears in the Netherlands are among the lowest in the EU, while homes are among the largest and most energy efficient. The Netherlands spends more than any other country on housing subsidies (mortgage interest deduction, reduced transfer tax), which seems to have limited effects on affordability.

Mike Langen
Senior Economist Housing Market
EU member states face housing market affordability problems
In an EU context, the Dutch housing market is still relatively affordable
Income growth and decreasing interest rates drive home prices the most
The building supply rate in the Netherlands matches the EU average
In comparison, Dutch homes have high quality and energy efficiency
Arrears are less common among Dutch households
EU housing markets share common problems
Homebuyers are struggling in the EU
The Dutch housing market is no fun. Currently there is a shortage of about 400,000 homes, increasing every year. Supply falls short mainly due to bottlenecks in infrastructure and planning. Another problem is the lack of investors, deterred by the government's unpredictable course. As a result, prices continue to rise and housing affordability declines. But housing is not just a Dutch problem. The European Commission (EC) . Across the European Union (EU), housing prices and rents are rising, reducing affordability and labour mobility, particularly affecting young Europeans. In this issue of the housing market monitor we therefore look beyond the Dutch border and compare European housing markets. We focus on owner-occupied housing and study supply and demand in different countries. We want to highlight how the Netherlands compares to the rest of the EU.
Housing markets in the EU have many similarities
Housing markets tend to differ by country due to geography, housing policies and history. So why are we comparing different EU housing markets? First, euro countries have the same monetary policy, with (mortgage) interest rates being influenced by the European Central Bank (ECB) policy. Second, the EU has open borders, leading to cross-border flows of construction materials, labour, and migration. For example, EU citizens can leave their home country and move to other EU countries with better work and housing opportunities. Third, regulations affect all EU countries. Therefore, we believe that EU housing markets are interconnected. For example, the Netherlands experiences a from other EU countries every year.
International investors see Europe in regions, so the Netherlands is competing for investment with other countries
Another aspect to consider are international real estate investors. They are looking for investments around the world to spread their risk. For countries like the Netherlands, because they help to start new construction projects. However, because of the similarities between real estate markets in the EU, investors often do not distinguish between different countries, but between broader regions when considering their investments. Therefore, the Netherlands for international housing investment. Overheated housing markets are not attractive to investors because there is a higher risk of price declines and unstable returns. It is therefore also interesting from this point of view to look at the Dutch housing market in the European context.
Housing prices and housing demand
Dutch house price development is not unusual in the EU context
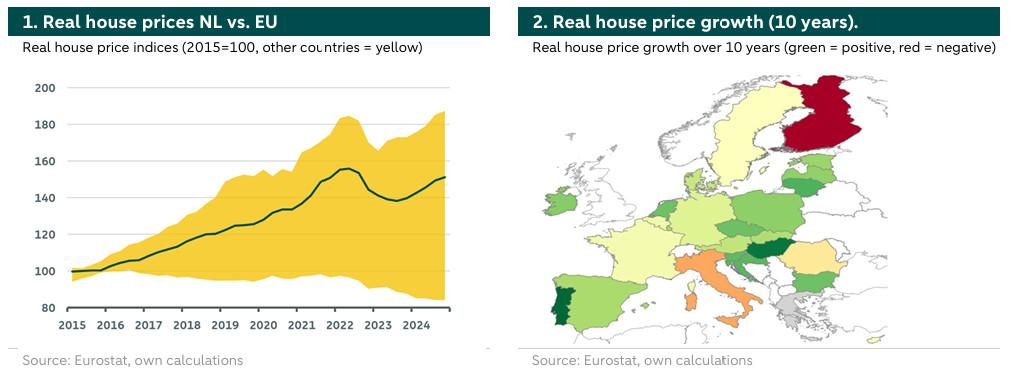
Figure 1 shows the real house price index of the Netherlands and the range for all EU member states over the past 10 years*. Unlike nominal indices, real house price indices are adjusted for national inflation, which is necessary to compare different countries. The top 3 countries with the highest real house price growth are Portugal (+85%), Hungary (+80%) and Lithuania (+56%), while the Netherlands ranks 7th with +48% price growth over the past 10 years. The median growth in the EU is +32%, but we see a lot of variation and some countries even have negative price growth. Finland (-15%), Italy (-6.4%) and Romania (-2.2%) saw real house prices fall. Looking at our neighbouring countries, Belgium (+6.8%) and Germany (+14.1%) experienced fairly moderate price growth over the past 10 years. Figure 2 shows the positive (green) and negative (red) house price growth over 10 years by country. While there is no obvious pattern, the map suggests that Eastern European countries show the highest price increases.
*The exact time period is 2015 through 2024.
Population growth has a limited effect on house prices
We analyse which demand factors affect national house prices across EU countries. Housing demand is generally driven by three main factors: population growth (how many people need housing), income growth (how much can people pay for housing) and financial markets (how expensive is financing). The top three countries with the highest population growth from 2014 to 2024 are Malta (+28.4%), Luxembourg (+19%) and Ireland (+14%). The Netherlands ranks 7th with a population growth of +6.2% over 10 years. However, we find population growth has a limited effect on house prices. In Figure 3, we plot population growth by country against real house price growth. Even though the yellow regression line suggests a slightly negative relationship, it is not statistically significant. This could be explained by adjustments in housing supply in response to housing demand due to population growth. For example, the Romanian population has been declining for years. As a result, fewer houses are being built, causing prices to stabilize and sometimes even rise. The same works the other way around: more houses are built in countries where population growth is expected to be strong.
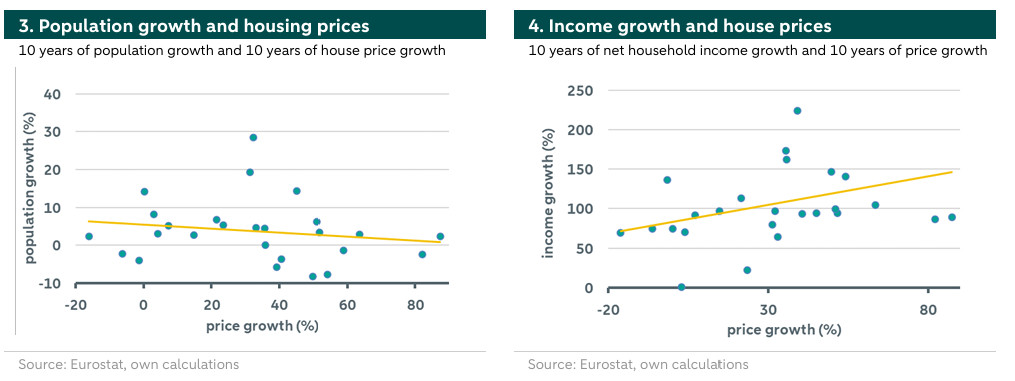
Income growth drives up house prices. The second demand factor is income growth. As income increases, people can afford to pay more for a home or even buy an investment property. Household income usually increases with a country's gross domestic product (GDP). Many Eastern European countries experienced strong GDP growth after joining the EU because their goods and labour were cheap compared to the EU. It is therefore not surprising that the top three countries with 10-year growth in net household income are Lithuania (+148%), Romania (+145%) and Bulgaria (+142%). The Netherlands ranks 14th with net income growth of +36%, in line with the EU median (+36%)*. Figure 4 plots 10-year nominal income growth over real house price growth. We find a significant positive relationship, suggesting that income growth drives real house prices. An outlier is Romania, where house prices did not rise significantly despite strong income growth. This may be due to a robust housing supply and a declining population.
*We calculate the average growth in net income between family households and single-person households, which takes better account of tax reforms than gross income.
When debt financing is high, mortgage rates are a major price determinant
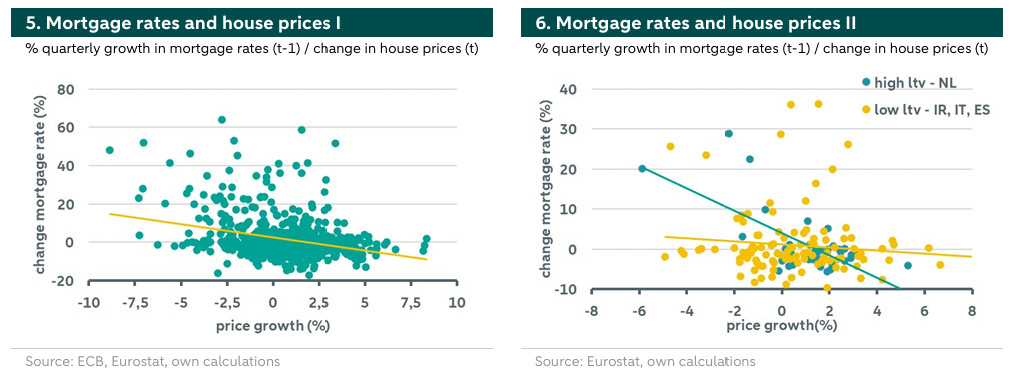
Another factor influencing demand for homes are financial markets. Probably the most important aspect are mortgage interest rates, which determine financing costs and borrowing capacity. Figure 5 shows the quarterly change in local mortgage rates (%) relative to the quarterly growth in real house prices (%) for all EU countries from 2014 to 2024*. We find a significant negative relationship, indicating that falling mortgage rates increase real house prices. A second factor affecting housing demand are lending standards: the maximum mortgage relative to income (loan-to-income) and/or collateral value (loan-to-value: LTV). High LTV ratios require less savings to buy a home, stimulating demand. After the financial crisis, many countries gradually lowered their to reduce national mortgage debt, which had a negative effect on house prices. However, there are still large differences within the EU, which affects sensitivity to changes in mortgage rates. To illustrate this, in Figure 6 we plot changes in mortgage rates over house prices for the Netherlands (historically high LTV ratios >90%), and Italy, Ireland and Spain ( in the euro area). We see that the relationship between mortgage rates and house prices is much stronger in the Netherlands than in the low LTV countries. This means when more houses are financed with debt, the housing market reacts more strongly to changes in mortgage rates.
*We use national data for all euro countries from 2015 to 2024. We lag mortgage rates by 1 quarter and apply a panel regression (fixed-effects model) to determine significance.
Housing subsidies can drive up housing prices
A final demand factor are housing subsidies. Through subsidies or tax breaks, policymakers make home ownership or investment in real estate more attractive. For example, the Netherlands has mortgage interest rate deduction, in which first-time buyers get a portion of their annual interest payments back in the form of tax breaks. In 2022, the Netherlands spent almostof GDP on housing subsidies for home buyers and owners*. This is almost three times as much as Sweden (0.4%) and six times as much as Luxembourg (0.23%), the second and third highest in the EU. Incentive programs are controversial because they effectively subsidize home ownership, increasing demand for homes and consequentially house prices. However, many programs were set up in response to high housing prices and affordability problems. So even though many countries with high house prices spend heavily on subsidy programs, causality is not necessarily there. Another problem is that incentive programs, once implemented, are difficult to get rid of because of the danger of house price declines and mortgage payment defaults.
*This includes subsidies from reduced transfer taxes for certain age groups
Housing supply and housing shortage
After the great financial crisis, the construction sector in the EU collapsed
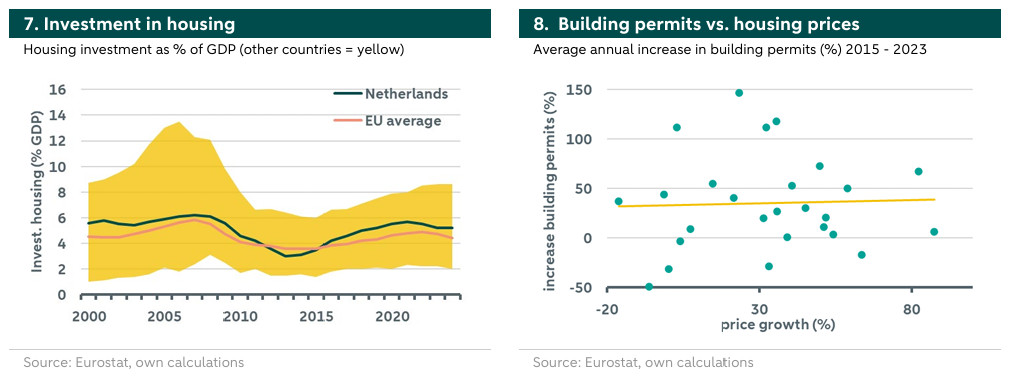
So far we have focused on the effect of housing demand and house prices. Now we look at housing supply in different EU countries. Figure 7 shows housing investment as a percentage of GDP, focusing on the Netherlands and the EU average. After the great financial crisis in 2008, housing investment declined in most EU countries. Investors walked away and prices fell. In the Netherlands, investment fell from 6% to 3% of GDP in 2013. This had a major impact on the construction sector, where many people left. Between 2008 and 2015, about 16% of Dutch construction workers left the sector. Although investment returned relatively quickly, this was not the case for construction workers due to uncertainty and long training cycles. Only in 2020 did the number of construction workers reach 2008 levels again. The labour shortage not only slowed supply but also drove upof new housing constructions.
Building permits do not seem to affect house prices
The number of fell in many countries after the financial crisis before rising again. In the years 2015 to 2023, the average annual number of building permits in the Netherlands was 11.5% higher compared to the years 2008 to 2014, while the EU average was a 35% annual increase. However, as Figure 8 shows there seems to be no relationship between the average annual increase in building permits since 2015 and cumulative house price growth since 2015. This is also because supply partly follows demand, meaning that the number of building permits increases when house prices rise. Vice versa, in Italy and Finland the number of building permits and house prices fell, indicating that supply adjusted to factors such as a declining population. We also know from the Netherlands that building permits do not necessarily lead to new homes. Since the nitrogen ruling in 2019, many construction projects were halted despite a valid permit.
The share of new homes completed shows no correlation with house prices
According to an , the Netherlands delivered 0.9% of its housing stock in new homes by 2022, which is in line with the EU average of 0.9%. The highest percentages within the EU were seen in Luxembourg (1.9%), Poland (1.5%) and Austria (1.5%), while the lowest in Latvia, Portugal and Spain (all three less than 0.5%). For most EU countries, including the Netherlands, we see an upward trend as the percentages increased compared to 2011. However, a high or low supply of new homes does not seem to be a clear indicator of long-term price growth. For example, Portugal and Luxembourg both experience high house price growth, while being at different ends in terms of relative new supply.
Housing shortages and price growth seem unrelated
What if supply is clearly too low, resulting in a housing shortage? In the Netherlands, the housing shortage is currently estimated at about 400,000 homes out of a building stock of about 8.2 million homes, or about 5%. Surprisingly, most EU countries do not report a national housing shortage. However, many countries face local housing shortages, mostly in cities due to urbanization. This is often accompanied by high vacancy rates in rural regions (oversupply), resulting in no net national deficit. While this can lead to high housing prices locally, it is not possible to evaluate the extent based on national statistics. However, some countries do report a national housing shortage, such as Germany (1.6% of the stock), Ireland (12%), Slovakia (15%), Poland (9.8%), Sweden (3%) and Spain (2%). Compared to these countries, the Dutch housing shortage is not exceptionally high. Moreover, some of these countries show lower price growth, indicating that shortages may only occur in certain market segments, such as (social) rental market segments.
The quality of housing supply may not match the demand for housing, which can still lead to price increases
An important aspect of differences in housing supply is the type or quality of supply. For example, the Netherlands and many other EU countries have seen an increase in the nu for years. Nevertheless, the proportion of large and small homes in new construction has hardly changed, resulting in a mismatch between the quality of supply and demand. This can lead to shortages and rising prices in certain segments despite an apparently large housing supply. Another aspect is the division of supply into (social) rental and owner-occupied markets. In a free market, housing that comes on the market can end up in the rental or owner-occupied segment. But in some countries, such as the Netherlands, housing is built specifically for the rental or owner-occupied segment. This is achieved through building quotas for developer and state-supported social housing program. The Netherlands currently has the highest share of n the housing stock relative to the EU (34% by 2022). These houses are not intended for the free market, which means that the supply for the owner-occupied market is only a fraction of the national housing supply. We saw that the Netherlands adds about 0.9% of new housing stock each year. Assuming that 1/3 or more ends up in social housing, the actual supply for the free market is only 0.6% or less. This puts us at the bottom of the EU rankings and may be too little for the owner-occupied market.
Affordability and quality of housing
The Dutch price-to-income ratio rose only slightly
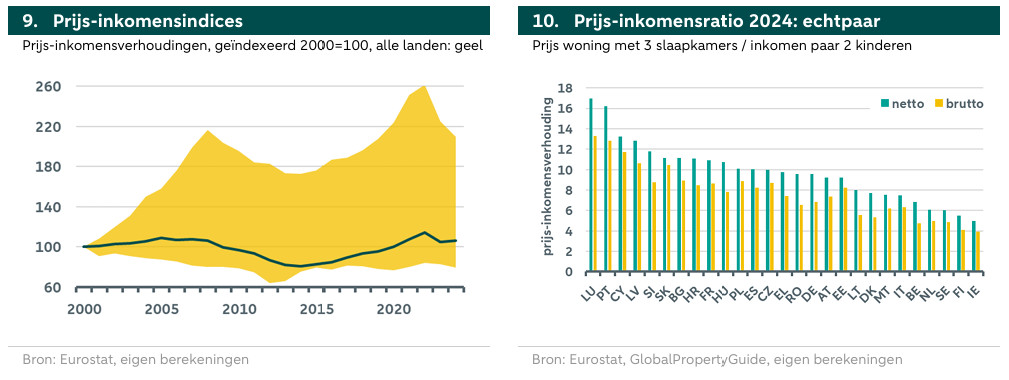
Rising house prices alone are not bad, as long as they keep pace with income increases. The relationship between house prices and income is expressed in the price-income ratio. Figure 9 shows price-income indices from 2000 to 2024, with the Netherlands in green and the range of other countries in yellow. Positive growth indicates that housing prices have increased more relatively to household incomes, meaning that housing affordability has declined. During this period, the three countries with the highest price-income growth are Luxembourg (+110%), Malta (+65%) and Sweden (+54%). The Netherlands ranks only 12e with an increase of +6.5%. Thus, housing affordability in the Netherlands has hardly changed. However, price-income ratios are also a matter of perspective, as different countries have different periods of boom and bust. For example, price-income ratios in the Netherlands rose just before the financial crisis, after which they fell to an all-time low in 2014. So if we look at the period from 2014 to now, the Dutch price-income ratio increased by +31.6%, the second highest in Europe.
Despite deteriorating trends, Dutch price-income ratios are still low
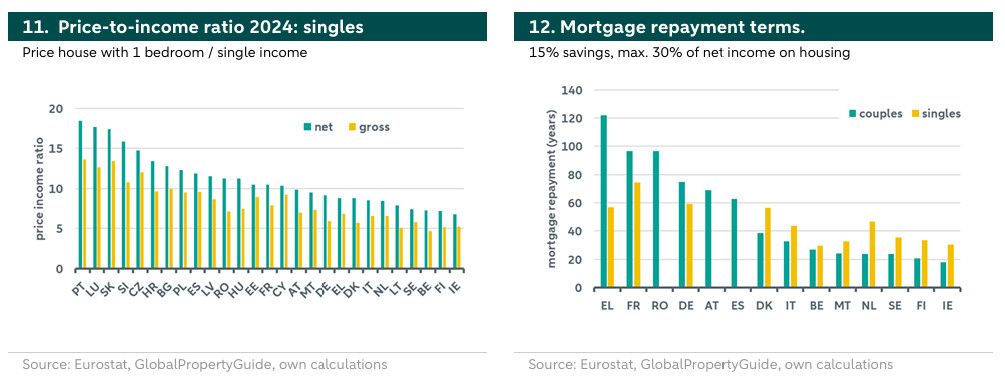
Price-income indices show changes over time, but do not allow comparing affordability across countries. Therefore, we estimate price-income ratios for 2024 by country. We use average house prices for a 3-bedroom house in mid-2024 and average household incomes in 2023 for a couple with two children and two average incomes. Figure 10 shows the estimated price-income ratios for gross and net incomes. In 2024, the Dutch price-income ratio of 6 is among the lowest in the EU, meaning that an average three-bedroom house costs about 6 household incomes per year. We also calculate price-income ratios for singles based on house prices for a 1-bedroom house and the average income of a single household. In Figure 11, the Dutch price-income ratio for single households is 8.5, which is low in the EU context (average 11). However, single households generally face higher price-income ratios and thus lower affordability.
Price-to-income ratios are closely tied to mortgage guidelines
A rule of thumb is that a price-to-income ratio of more than 10 indicates a problematic market for buyers. The reason for this are two mortgage financing guidelines applied by most banks. The first guideline states that households should spend a maximum of about 30% of their income on housing to stay financially sound and leave enough for other expenses and savings. Many banks follow this guideline by determining the maximum borrowing capacity based on household income. The second guideline tries to ensure that mortgages are repaid at a certain time. Therefore, most countries use a maximum mortgage term of 30 years. Some countries provide mortgages of 40 years with the restriction that the debt must be repaid before reaching retirement age.
Buying a house without assistance is problematic in most EU countries
We test housing affordability in the EU under the constraint of the 30% income rule. This means we assume that an average couple's household wants to buy an average three-bedroom house and spends a maximum of 30% of net income on the mortgage. We assume an LTV ratio of 85%, meaning households contribute 15% equity (e.g., savings). We assume a mid-2024 mortgage interest rate and an annuity mortgage (stable payments). Figure 12 shows the required mortgage repayment periods, assuming that households spend at most 30% of their net income on the mortgage. A Dutch couple with two average incomes would need about 24 years to pay off the mortgage, still below the 30-year guideline*. For most EU countries, that time frame is well above 40 years. Some countries are not even shown in our chart because monthly interest payments would exceed the threshold of 30% of income, making a mortgage impossible. For single-person households, we don’t find possible repayments within 30 years in any EU country. **
*We do not take into account the benefits of the mortgage interest rate deduction that allows even higher payments and thus a shorter repayment period.
**With the mortgage interest deduction in the Netherlands, this would theoretically be possible. But because this tax measure also depends on income and buying circumstances (first house?), we don't take that into account.
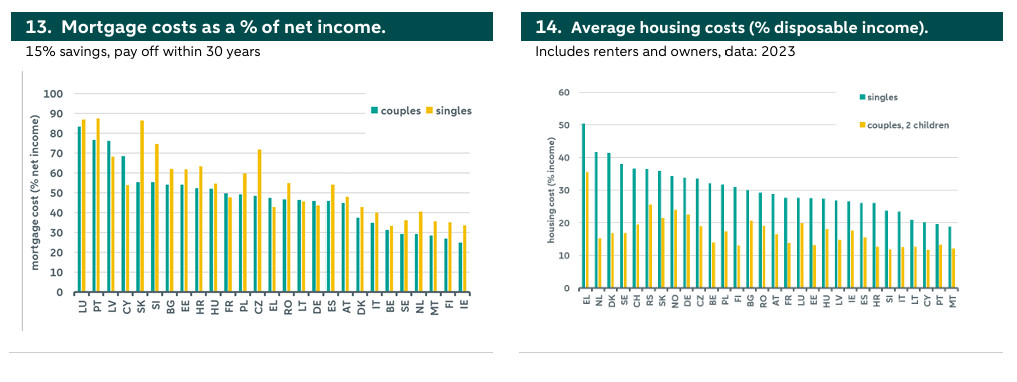
Single-person households in particular spend an alarming proportion of their income on housing
The 30% income guideline is designed to ensure financial health but not necessarily set in stone. We therefore test how high mortgage expenses must be to buy a house while paying it off within 30 years. We use the same assumptions as before. Figure 13 shows mortgage costs as a percentage of net income for couples and for singles. In the Netherlands, the share of net income is about 29% for couples and 40% for singles, among the lowest in the EU. In many EU countries, however, the share of net income is considerably higher, with an EU average of 48% and 54% for couples and singles, respectively. Looking at the entire housing market, including existing owners and renters, the results are similar except for singles. As shown in Figure 14, Dutch couples pay an average of 15.3% of their income on housing (EU average is 16.6%). Singles have the second highest housing costs in the EU, paying on average 41.7% of their disposable income on housing (EU average: 29.6%)*. The results suggest that households face a high financial burden to afford housing. In many EU countries, the share of households in , or rent has been increasing since 2019. The EU average in 2023 was 9.3%, with the top countries being Greece (47%), Bulgaria (19%) and Romania (14.4%)**. The Netherlands ranks last with the lowest percentage of 2.6%, indicating financial stability among most households. *We assume that this large difference between the Netherlands and the EU average has to do with the fact that single homes are not affordable in many countries. As a result, for example young people stay with their parents, which is why they are not included in the data.
**These are overdue payments for mortgages, rent or utility bills.
Additional housing purchase costs can further erode affordability
In our analysis, we ignore purchase costs and housing subsidies, which can further affect affordability. Furthermore, we have not taken into account transaction costs, such as taxes or brokerage fees, which can easily add up to 5-10%. In many countries, these are not financeable, meaning buyers have to bring in more equity. This means that with an LTV ratio of 85%, as in our example, households need to bring equity of about 20-25%. In the scenario of a Dutch couple, this would require about 80,000 euros in savings to buy a house. This is a significant threshold. In some countries, such as the Netherlands, the threshold can be lowered by increasing the LTV ratio. However, this raises monthly expenses, as interest expenses increase. Moreover, many EU countries have strict LTV standards, which do not allow more debt. Our estimate further ignores tax subsidies, such as the mortgage interest deduction in the Netherlands. These programs effectively reduce monthly costs. Banks might factor these benefits into mortgage lending, so households can borrow more money and the income share can exceed 30%.
There are affordability differences in urban and rural areas
Our estimated price-to-income ratios should be taken with a grain of salt because they are based on national average prices and incomes. While some countries have equal distributions of incomes and property prices, others have a lot of variation. For example, we see that many countries suffer from local housing shortages in cities and vacancies in rural areas. Therefore, actual price-to-income ratios may be higher in cities and lower in rural areas. As an indication of the differences in housing costs, Figure 15 shows the percentage of households with high housing costs by rural and urban areas in 2023. These households (renters and owners) face housing costs of more than 40% of their disposable income. In the Netherlands, 5.4% of rural and 11.7% of urban households face high housing costs.
Dutch houses are of high quality and often energy efficient, but that does not explain the rising prices
So far, we have assumed housing quality to be the same across countries. But if we look at quality characteristics, Dutch houses tend to be more spacious. Dutch households have an average of per person in 2023 compared to the EU average of 1.6. About 3.8% of Dutch households live in , compared to an EU average of 16.8%. Quality and energy efficiency also appear better. 7.1% of Dutch households report problems keeping their home (EU average 10.6%) and 15.4% report a leaking (EU average 15.5%). Overall, 59% of Dutch households live in a home where has improved over the past 5 years, compared to a EU average of 25.5%. However, if we look at quality statistics over time, we see that housing quality has improved only moderately in most countries. We therefore do not think this explains rising prices and reduced affordability.
