Top of Mind - AI capex boom to die another day

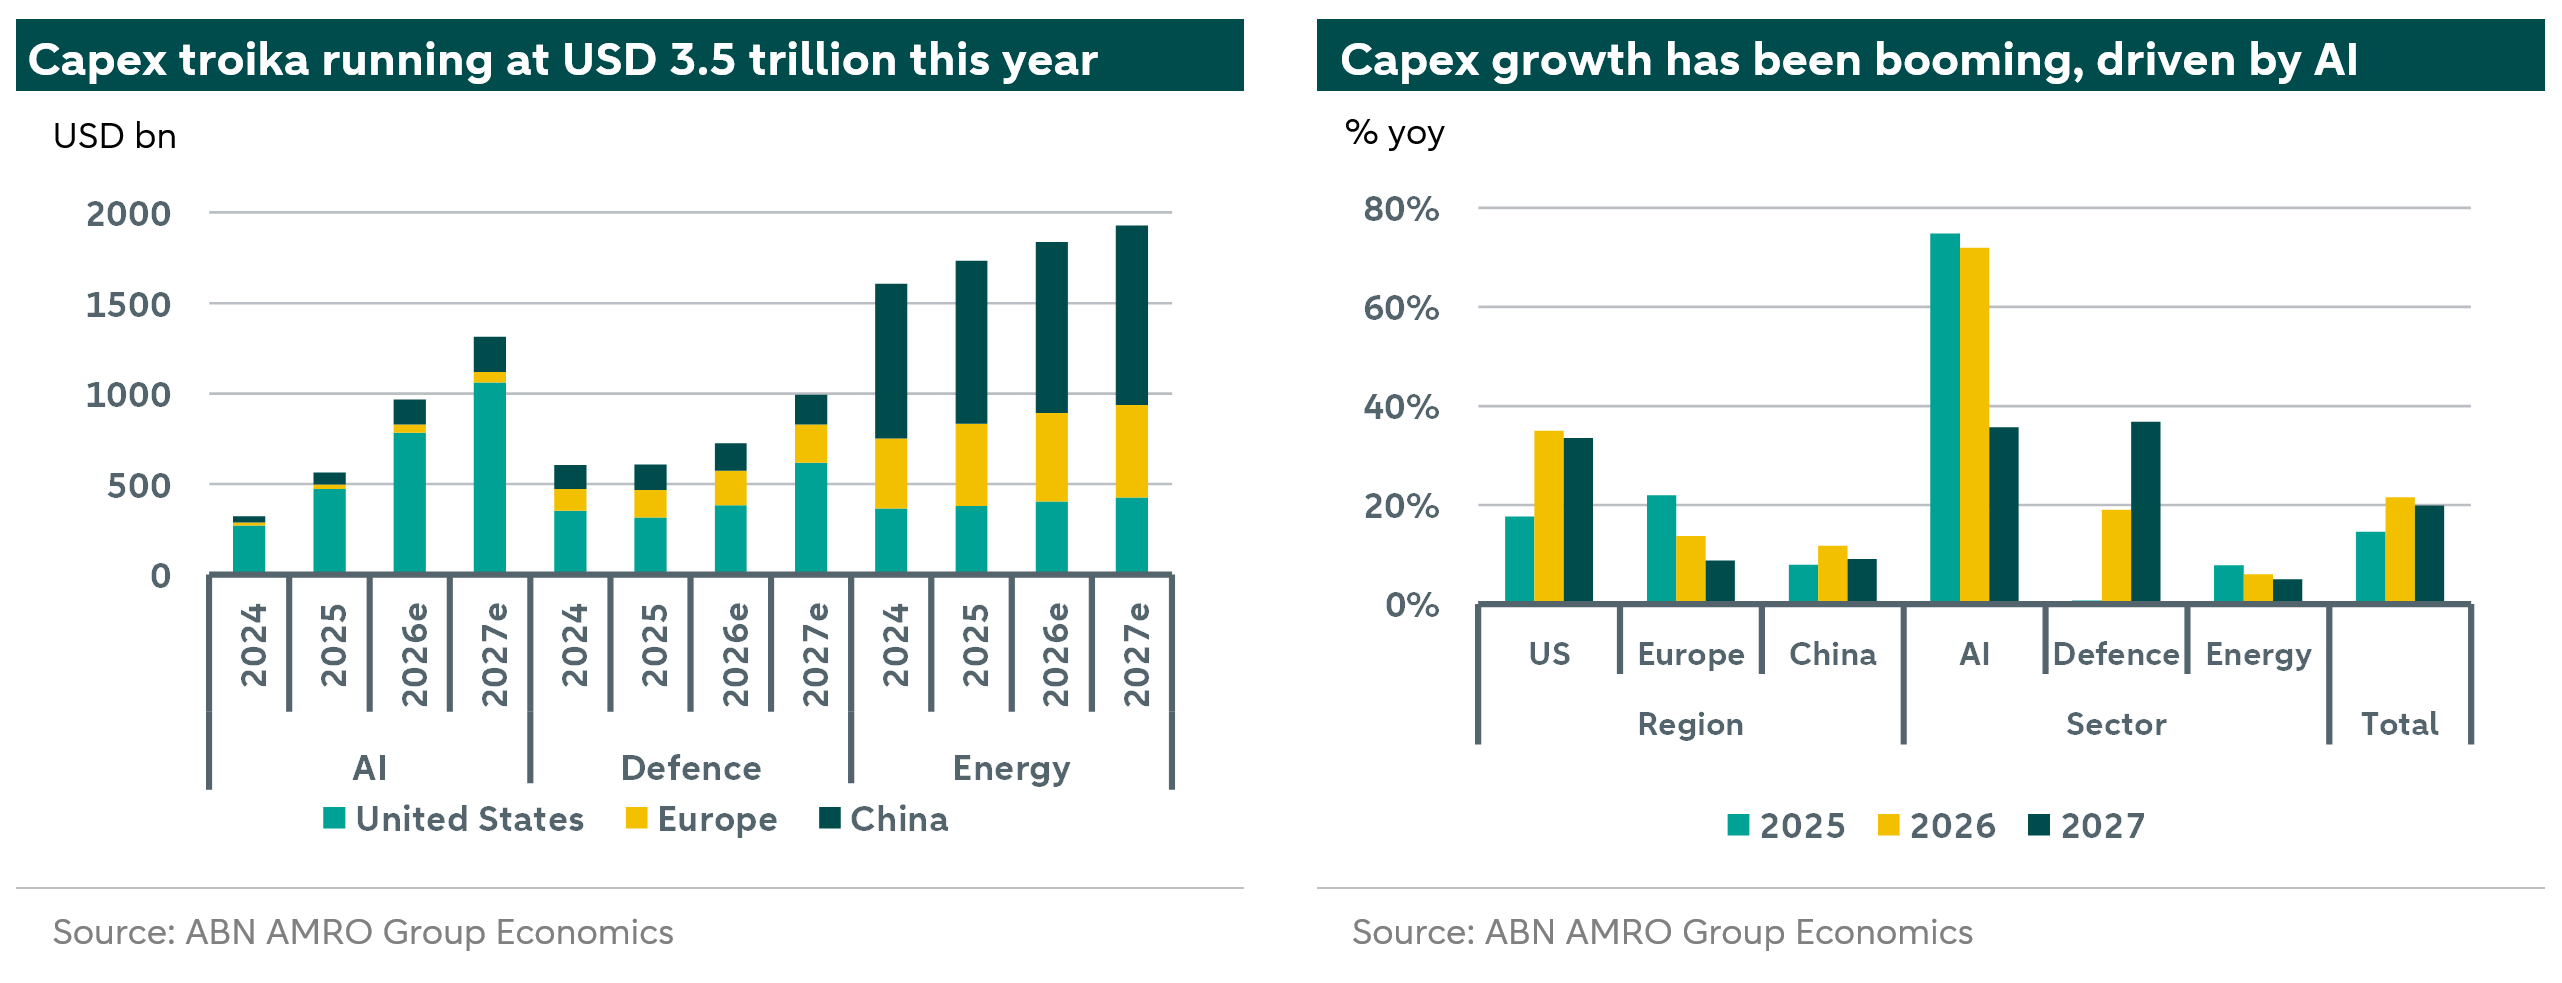
A troika of capex booms – AI, defence and clean energy – is set to reach USD 3.5 trillion this year across the US, Europe and China. The main growth impulse is coming from AI capex, which is growing rapidly, but signs are that the pace will slow in 2027. If AI capex is in line with guidance, the growth impulse will not fall off too much and will be more than offset by higher US defence investment. US capex will therefore remain strong but the spillovers to other economies will likely be less, while EU and China capex will slow. We do not expect an AI capex bust in the near term, but the economics do not bode well for the medium term: It will probably die another day.


Introduction
The global economy has been resilient to a range of shocks over the last two years, mostly emanating from geopolitics. One key reason for the enduring expansion is a remarkable capex troika: artificial intelligence, defence and clean energy. AI capex has been the fastest-growing category in the capex troika, with the growth rate across these regions running at more than 70% and providing the biggest impulse to global growth. However, the equity analyst consensus for the big US hyperscalers – which account for the lion’s share of investment in compute capacity – does raise some questions about the endurance of the growth impulse. In particular, although the level of investment is expected to be even higher next year than this year, the growth rate looks set to slow significantly. So does this mean that the capex super-cycle is set to lose pace? Will other categories such as defence and energy suffer the same fate? And should all this make us more cautious about global growth? The short answer to all three questions is no.
The capex troika has been driving global growth
We are in the midst of a structural capex super-cycle. AI capex is being driven by a spectacular push to build out compute capacity in the hope that the returns from the adoption of the technology are similarly spectacular. Defence capex has of course been a more persistent category, but has been driven upwards by war and geopolitical risk more broadly. Finally, clean energy capex has been strong for several years, reflecting the need to reduce emissions, but also to support electrification and reduce import dependence. Together, these categories amounted to an estimated USD 3.5 trillion across the US, China and the eurozone economies this year, or around 4.5% of the combined GDP of these economies. Although the scale of capex is large, both in dollar terms and relative to annual GDP, the ultimate impact on the cycle also depends on capex growth rates.
AI capex slowdown to be more than offset by defence
AI investment has grown at an exceptional pace, driven by hyperscalers, and now exceeds annual defence investment in the US and China. Energy-transition investment is growing more slowly, but is substantially larger and remains the dominant category in Europe and China. These categories accounted for around a quarter of investment growth in the EU in 2025 and more than half in the US. Their contribution appears to have increased further in 2026, accounting for roughly three quarters of US investment growth in the first half of the year. Taking all three categories and all three economies together, the capex troika was 0.9% GDP higher in 2026 than it was in 2025.
Slower capex growth among AI hyperscalers has raised concerns that this capex super-cycle is starting to wane. Based on company guidance as well as the equity analyst consensus, AI investment growth is likely to slow from more than 70% in each of the past two years to around 40% in 2027. We think these concerns are overblown. Global investment growth across the three categories should slow only marginally in 2027 from around 22% to 20%, while the impulse to economic growth will not fall off too much, because the starting level of capex (due to the rising share of AI as % GDP – see below) is higher. The larger share means its contribution to growth for any given growth rate is larger.
The shift across categories and regions is more significant. Higher US defence spending will offset the moderating contribution of AI. Defence is emerging as a second source of US demand. US military operations in Iran have created a more immediate need to replenish equipment and munitions. Our estimates are based on current procurement plans. Congress is also discussing an additional USD 250bn for 2027, alongside a USD 350bn reconciliation tranche. Neither amount is fixed, and the normal lag between authorisation, orders and delivery means the spending would be spread over several years. We have therefore not fully included these amounts in our central estimates, leaving upside risk. For the US, the net impact of the shift in AI and defence might actually be positive for GDP, because, as discussed below, defence equipment is almost all made domestically. This also means that spillovers to the rest of the global economy will be smaller.
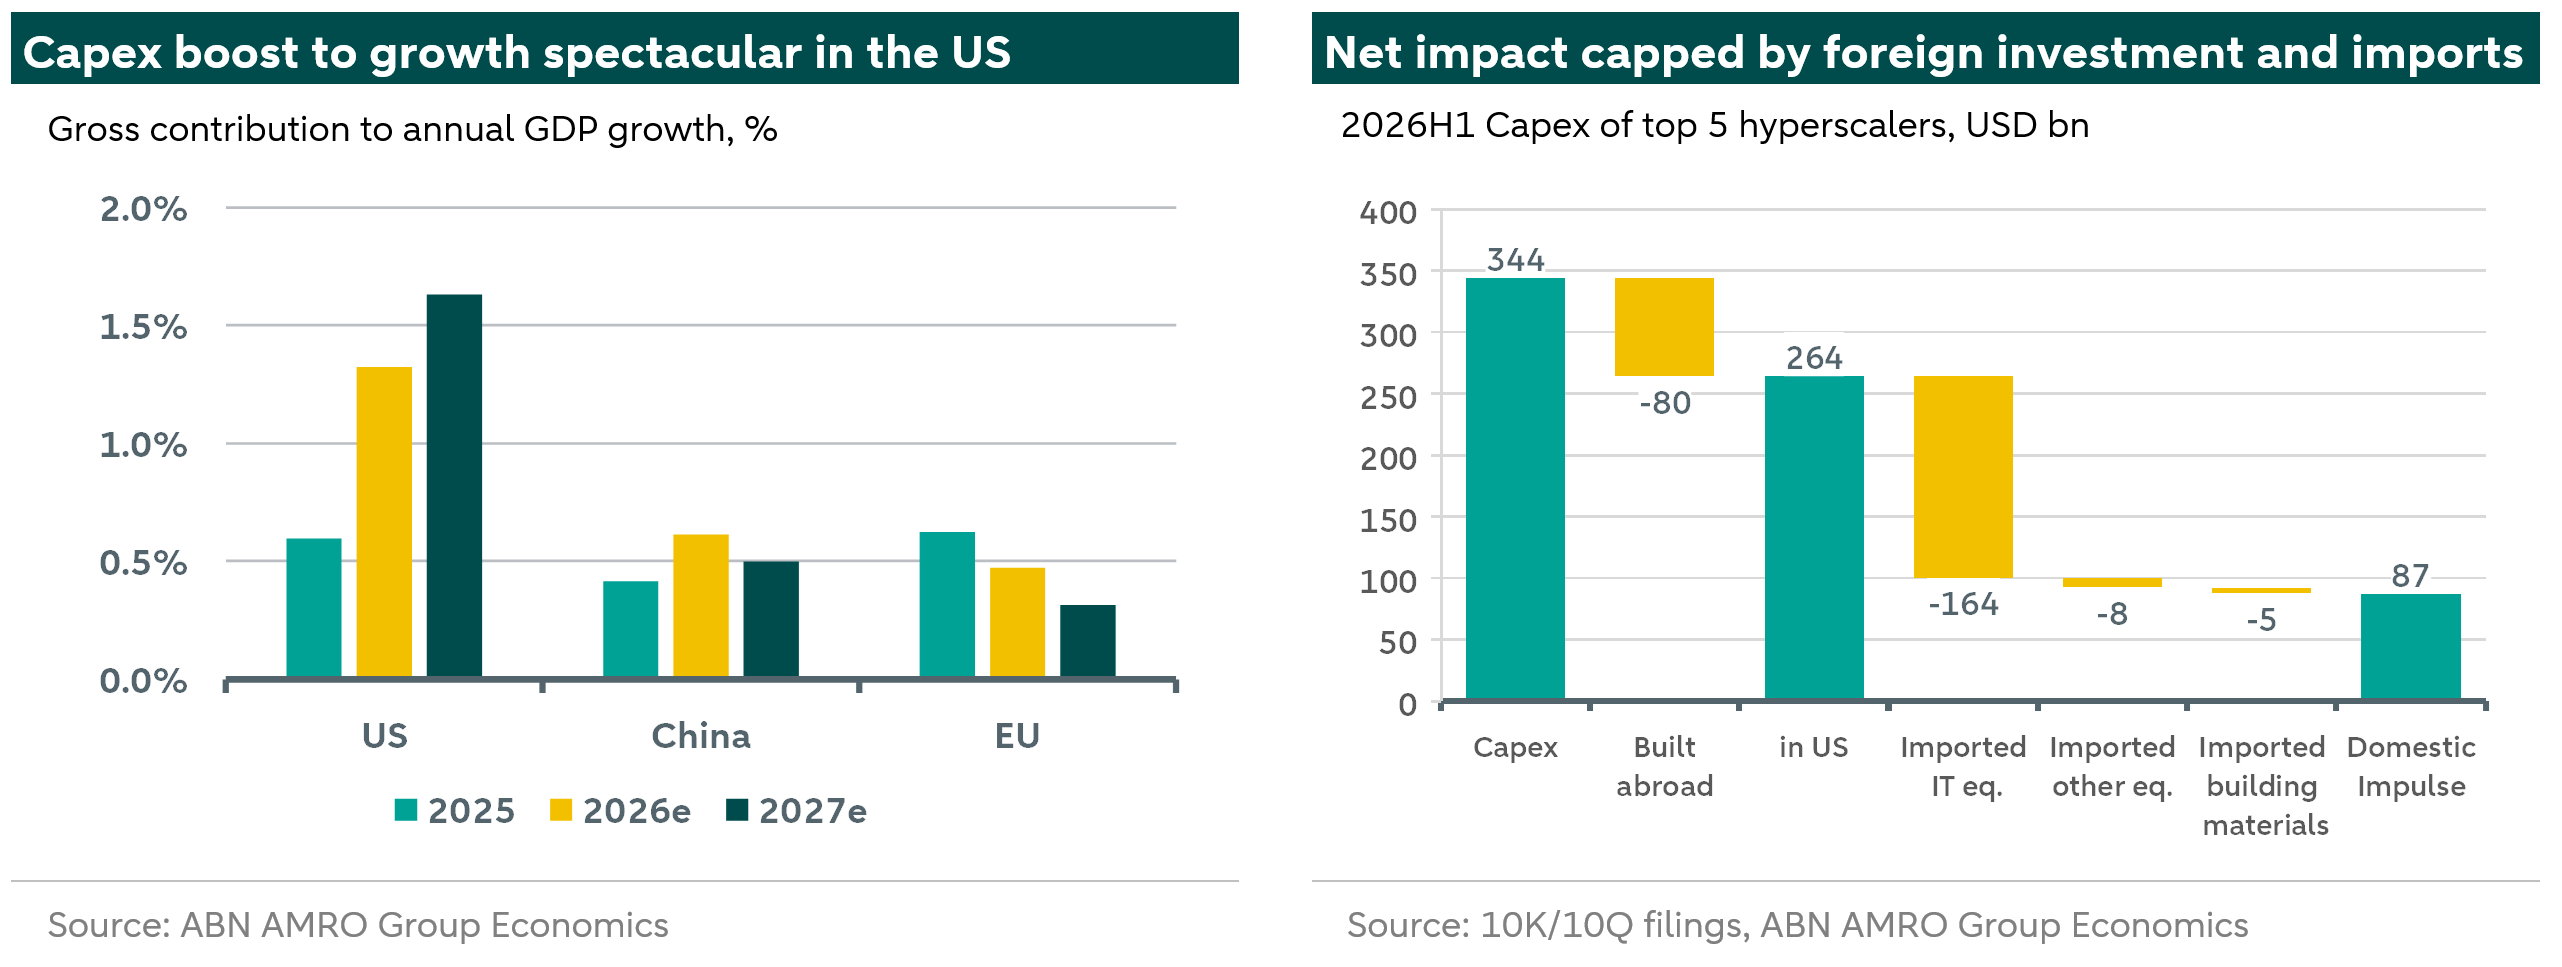
For Europe, capex is substantial – at USD 725bn in 2026 and USD 793bn in 2027 – reflecting mainly ongoing high levels of clean energy investment and the recent acceleration in defence investment as Member States continue efforts to strengthen Europe’s defence capabilities and readiness. However, AI investment remains rather modest. In addition, the total capex troika is running well below US levels relative to the size of the economy. For instance, the capex troika in the US is expected to be equivalent to more than 6% of its economy next year, whereas for the EU it is seen at 3.5% GDP. In addition, the acceleration in the US is also much more rapid, so while the US capex impulse next year is 1.6% GDP (with some proportion of that leaking abroad), for the EU it is just 0.3% GDP. China follows a steadier path, with energy investment anchoring continued growth in AI and defence spending.
Growth rates strong, but imports limit impulse
That translates into a large global growth boost, but the direct impulse does not necessarily land where the capex takes place, as capex tends to be very import-intensive. The countries where the equipment is manufactured benefit at least as much. For instance, according to the IMF, Taiwan and Korea source 62 percent of the net trade in computing hardware related to AI, while Malaysia, Mexico and the Netherlands are also significant net exporters. At the same time, the US and China are responsible for more than 75 percent of the net imports of AI-related computing hardware. The chart above demonstrates how only a fraction of US hyperscaler capex ultimately ends up in the US economy, and that fraction has been decreasing. On the other hand, China has gradually reduced its dependence on foreign suppliers for the AI buildout.
Beyond AI, Europe’s clean tech capex relies heavily on China, with 74% of the imports in this category coming from China. In contrast, defence capex goes almost entirely towards equipment manufactured domestically in the US and China, whereas in Europe the domestic share has tended to be less than half. The US has historically been a key supplier, though Europe is making efforts to strengthen its defence industrial base. This also has ramifications for the import share of the capex troika. With defence becoming a more important component in the US cycle, the overall import share is likely to decline, meaning that the net impulse for 2027 may grow even stronger than the gross impulse.
AI capex boom may die another day
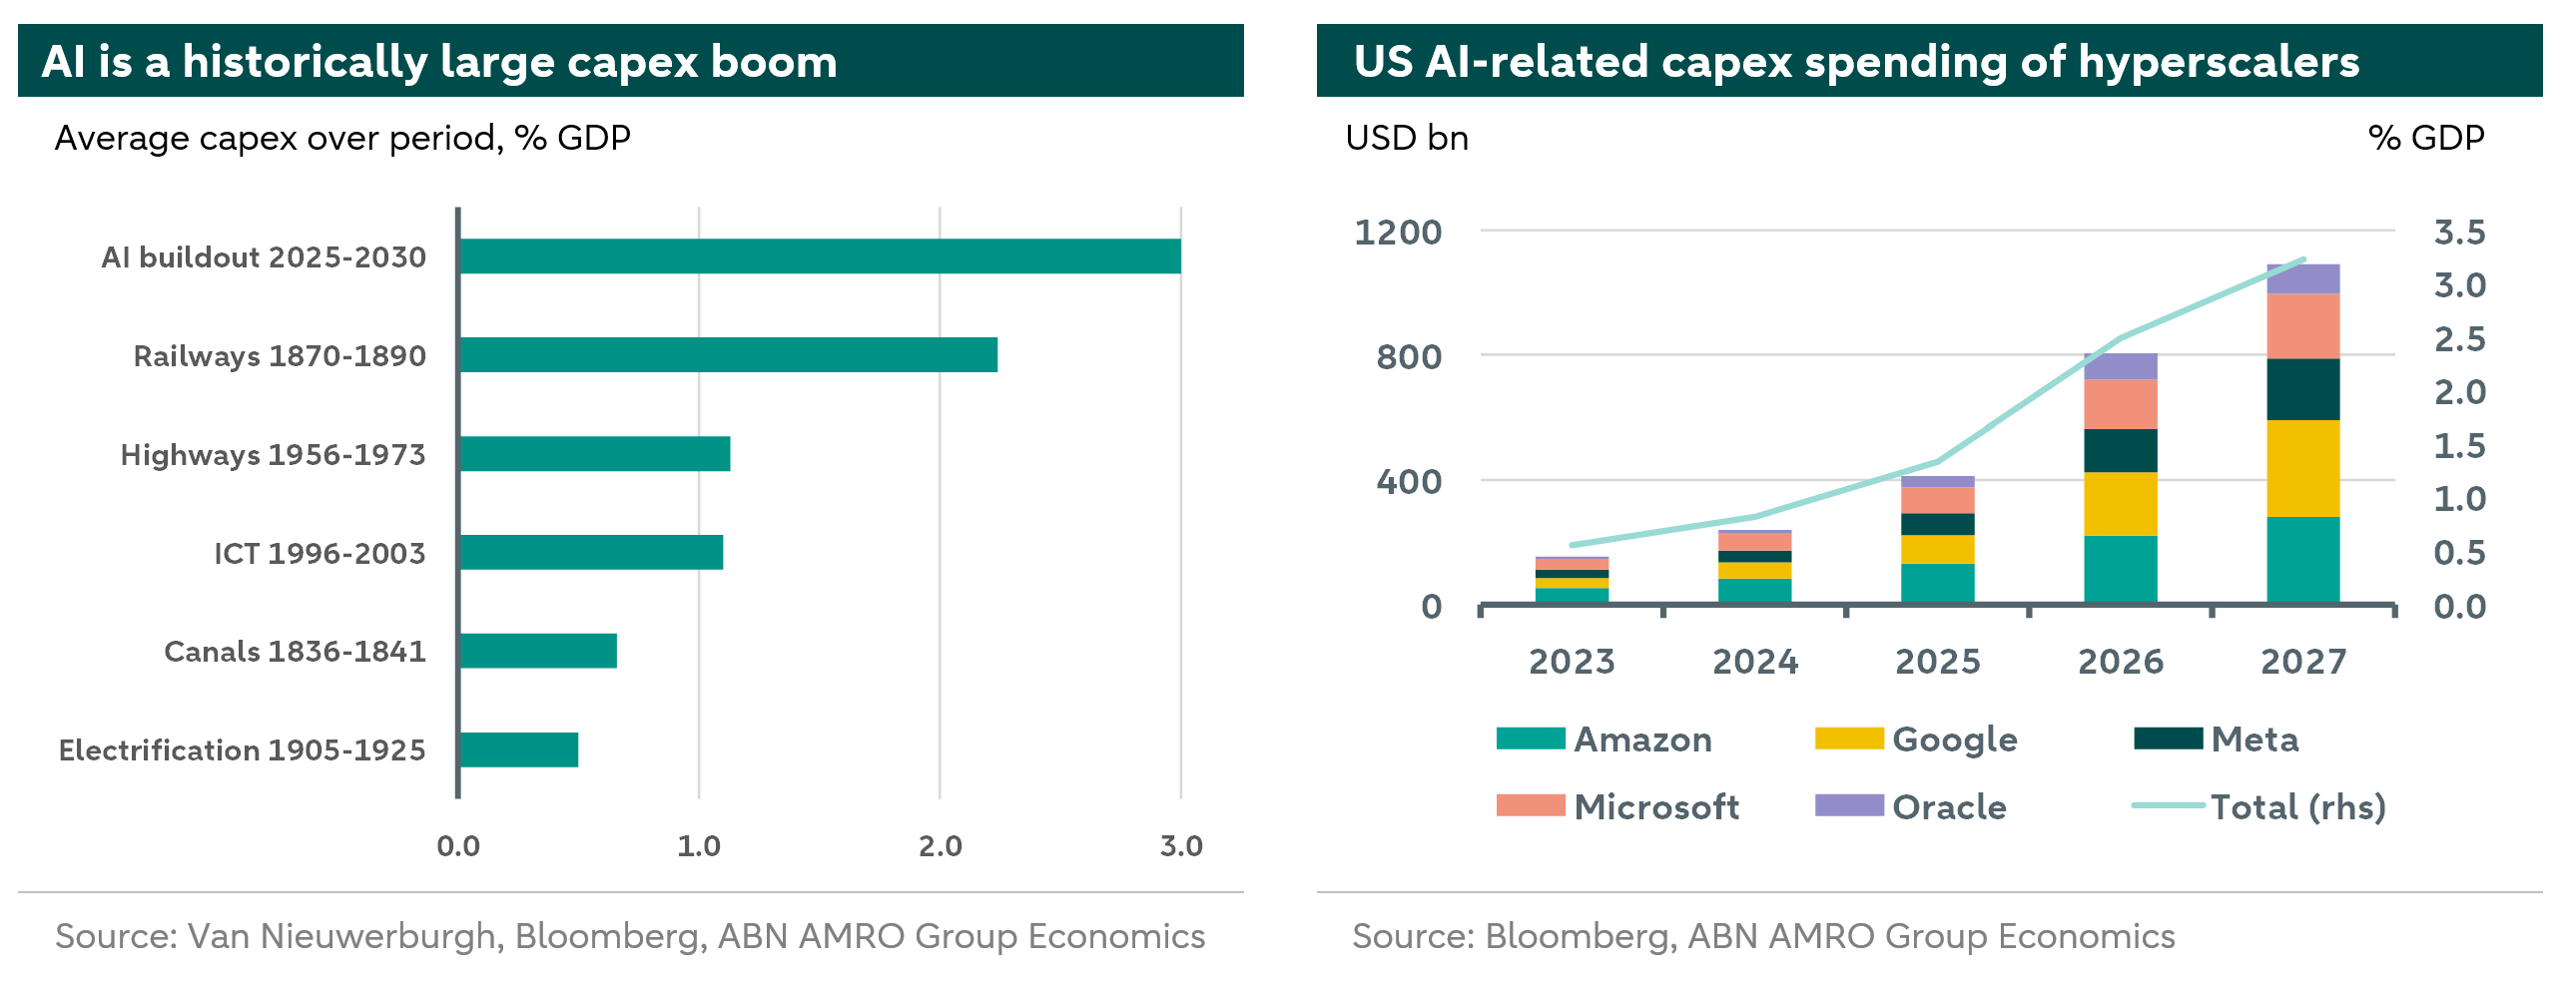
Markets have started to wobble on investor fears that the sell-off in data centre bonds might be a canary in the coal mine for the AI capex boom more widely. Indeed, technology revolutions typically see a bubble inflate and eventually pop. AI investment spending looks like it will be the biggest innovation-led cycle in history. During 2025-2030, average annual investment in AI is projected to be around 3% GDP according to the consensus forecast of equity analysts, which is considerably more than in technology-led capex booms of the past. On this basis, AI investment would be around three times as large as that of ICT. The Bank for International Settlements has warned that the AI capex boom is reminiscent of these previous historical investment booms, where capital was invested in excess of what could be justified by commercial returns. In these previous situations, at some point the investment boom turned into an investment bust.
The big question therefore is whether AI revenue can pay the full cost of the capacity being built. Based on the framework in Van Nieuwerburgh (see ), we set up a number of scenarios. End-user AI revenue covered 31% of the cost of building in 2024, 26% in 2025 and about 37% in 2026. The gap is closing because demand is real: over the past year the volume of AI usage (tokens processed) grew about seven-fold and revenue four-fold, while revenue per token fell by less than half, as users moved to better and more expensive models. Covering the bill by 2030 means revenue has to keep roughly doubling every year.
Required revenue has two parts. The first is a yearly capital charge that pays back what was spent plus an assumed 10% cost of capital: servers are paid off over an assumed 6 years, while buildings, power and cooling infrastructure are paid off over 20 years. The second is running costs, in the form of power, staff and R&D. We consider three scenarios. First, capex stops growing, levelling off after 2027, yet the bill still keeps building because each year’s new capacity adds to the charges on everything built before. Second, capex keeps growing at 35% y/y. Third, we consider a faster depreciation scenario in which chips have to be replaced every 3 years instead. Another scenario could entail a higher cost of capital. Increasing it to 15% would increase the required return by about a quarter in each of the scenarios.
On the revenue side, we consider a Goldilocks scenario. Revenues triple in 2027 and keep growing at a diminishing pace, although still rising by 60% in 2030 relative to 2029. A gradual fade scenario lowers the annual revenue growth multiples to a range of 2.5 to 1.4 over that same period. An open-model scenario assumes a greater shift to open-model tokens, which currently cost about a seventh as much per token. A final scenario lets revenue per token fall by a factor of 2.5 a year, compared with a factor of 1.7 last year.
The build-out pays for itself only if revenue grows strongly, prices hold up, chips last their booked six years, and capex growth remains contained.
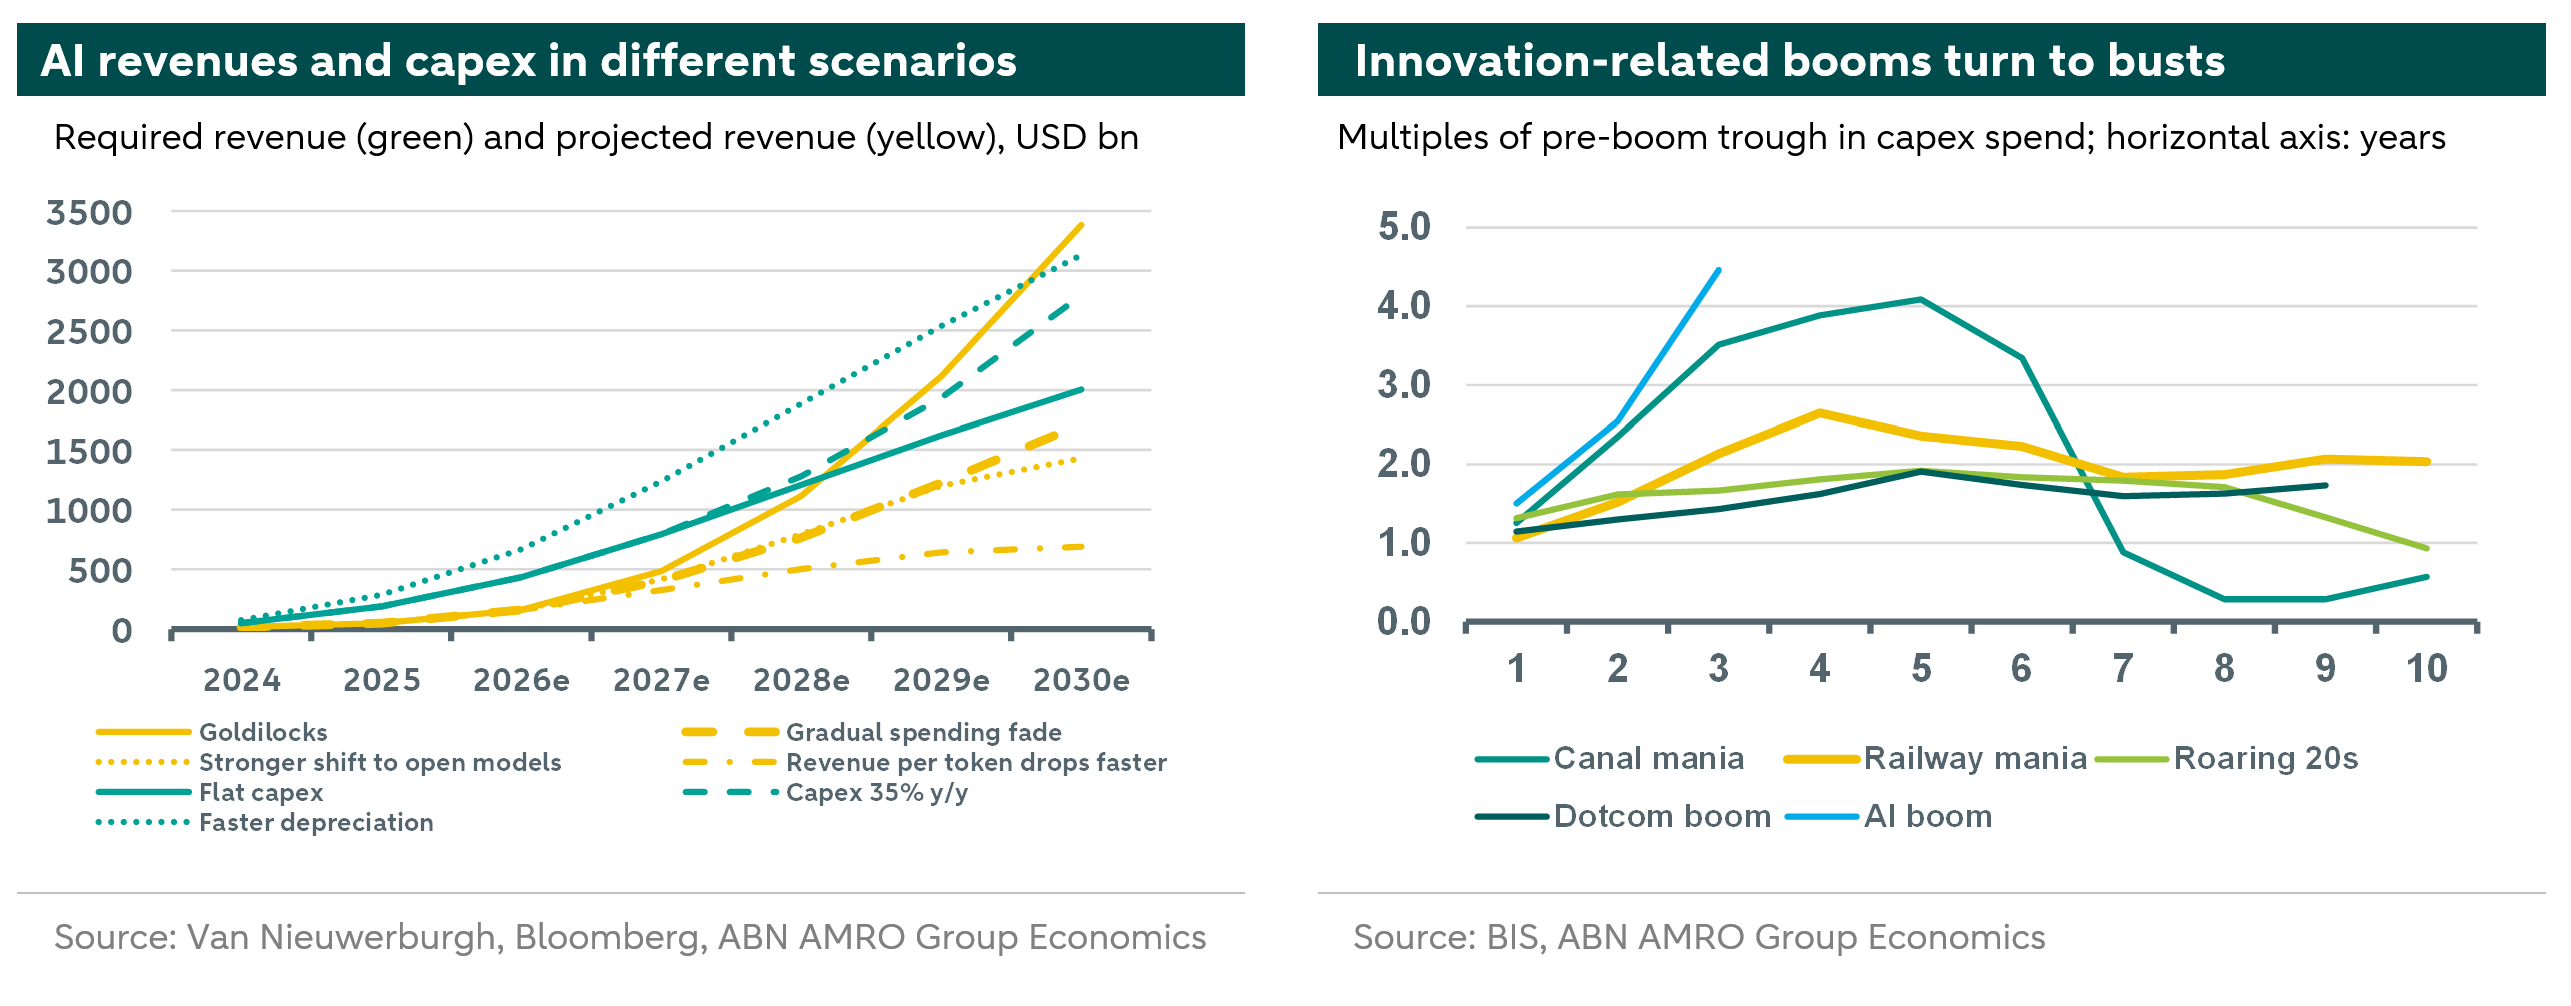
So commercial revenues and the productivity acceleration from AI would need to be extraordinary to justify the spectacular investment spending. While such a scenario is still within the realm of reasonable possibility, it looks extremely challenging. So a correction at some point looks likely and would be very much in line with historical experience. Such a correction would naturally also have consequences for the growth impulse. At this point in time, revenue growth is on track to reach the revenue required to justify the capex, while demand for compute is still growing strongly, with GPU rental prices still on an upward march. Revenue developments over the next two years will be critical.