US - Fed cuts by 50 bps, recession imminent?

The Fed decided on a 50 bps cut to initiate its easing cycle. Outsized rate cuts are usually reserved for cycles where recessions have started or are imminent. There are pockets of weakness in growth and the labor market, but risks of a recession remain contained.
The Federal Reserve initiated its easing cycle with a 50 bps cut. Previous easing cycles that started off with the greater than default 25 bps, include the 100 bps cut in January 2001, which was followed by the early 2000s recession, and the 50 bps cut in August 2007, followed by the great financial crisis. Indeed, a 50 bps cut is often associated with the objective of averting, or reducing the depth, of an impending recession. Easing cycles that started with 25 bps were generally more about easing restrictiveness, rather than saving the economy, not unlike the narrative behind the current easing. Indeed, Chair Powell summarized it as ‘The US economy is in a good place, and our decision today is designed to keep it there.’ This is exactly the line of communication that was anticipated in case of a 50 bps cut, but do actions speak louder than words? What is the evidence for an incoming recession, or has it already arrived?
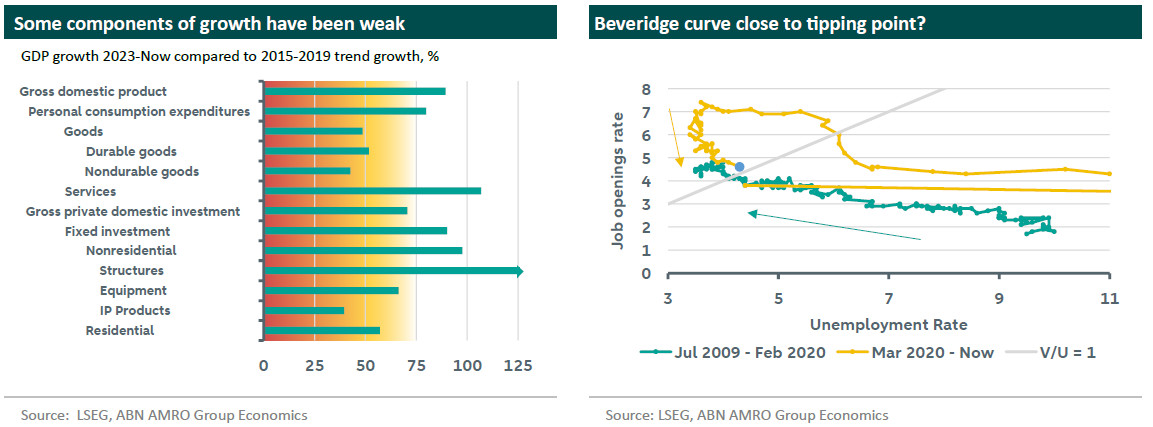
A recession is predominantly a statement about economic growth, formally defined as two quarters of negative growth. Headline GDP growth has come nowhere near negative figures, although some of the sub-components reported by the Bureau of Economic Analysis have posted negative figures in either of the past two quarters. At the same time, over the 2015-2019 period, there were only six out of twenty quarters where none of these subcomponent showed negative growth. Negative realizations are inherent in the high month-to-month variability of the more granular data. Looking at the longer term, and taking 2015-2019 trend growth as a baseline, growth in some sectors has been pretty weak since the start of 2023. The chart below shows the ratio of actual growth to trend growth, and highlights that goods consumption and investment in equipment, intellectual property and residential housing have slowed substantially, while overall consumption and investment are supported by services and investment in structures respectively. The laggards are all interest rate sensitive components, and therefore a feature of tight monetary policy. They also have not materially deteriorated in 2024 compared to 2023. It is also important to note that the level of goods consumption is still well above pre-pandemic trend, despite the current slowdown, as evidenced in the box in the headline piece.

As growth is nowhere near recessionary territory, the Fed’s decision to cut by 50 bps was based on developments in the labor market, which serves as an early indicator. Powell pointed to the Beveridge curve, which plots the unemployment rate against the job openings rate. When job openings are plentiful, a reduction will not increase the unemployment rate, the relationship is ‘vertical.’ When vacancies decrease to levels near the total number of unemployed, further reductions might quickly translate into increases in the unemployment rate; the relationship is ‘horizontal.’ The chart above shows the period between July 2009 and February 2020 where job openings were increasing and the unemployment rate was decreasing sharply. The period of March 2020 until now is characterized by the covid-spike in unemployment, followed by a tight labor market where the openings rate peaked above 7%, with unemployment steady at levels below 4%. Since then, the openings rate declined to well below 5% without unemployment moving. The Fed’s worry is that we are close to entering the horizontal part, where further decreases in openings might translate to increases in unemployment quickly. Indeed, the tipping point is likely to be at a higher rate compared to previous cycles due to stronger labor supply growth. The deterioration in the labor market that became evident two days after the July meeting, prompted the 50 bps cut this meeting, and can be regarded as a catch-up. We continue to interpret the data as a labor market that is fundamentally stronger than the headline figure suggests, and expect the Fed to keep easing by 25 bps in the following meetings.
