Carbon Market Strategist - Carbon prices heat up in 2026

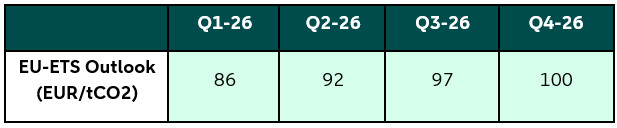
In this publication: A looming supply deficit in 2026 due to tightening emissions cap and reduced free allocations is a key driver of rising prices, with an expected supply reduction of around 180 million ton (YoY); Traders and funds are driving the bullish momentum with increased hedging and long contracts; Despite uncertainties around free allocation benchmarks and shipping allowances, tighter supply is expected to drive the upward trend in 2026; We see prices reaching 100 EUR/tCO2 by year end.

Introduction
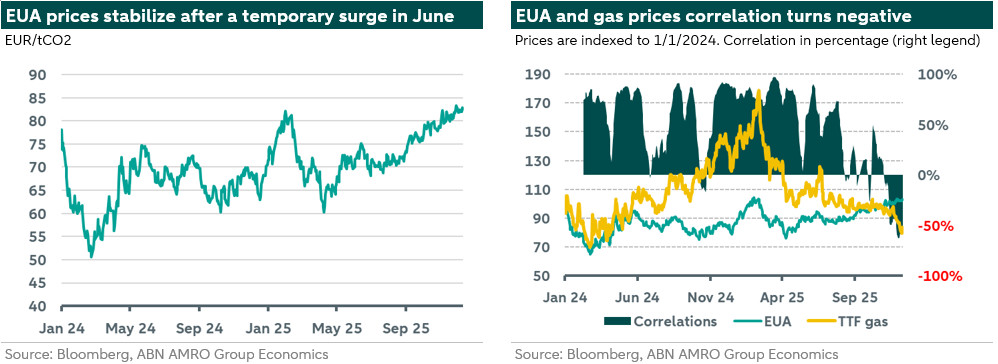
Since the beginning of Q4, European carbon prices have averaged 80 EUR/tCO2. This is 10% higher than in Q3. The upward trend that began in September is still in place. Carbon prices have even surpassed the 84 EUR/t level. Meanwhile, the relationship between gas and carbon prices has turned negative. Indeed, supply-demand dynamics are behind the rise in European carbon prices (EUA prices). Key driving factors include a looming supply deficit in 2026 and 2027, market sentiment, and upcoming regulatory changes, which are contributing to the bullish market positioning. However, looking ahead, short term European carbon prices remain vulnerable to fluctuations caused by weather conditions and geopolitical risks, particularly a potential peace agreement between Russia and Ukraine could send carbon prices lower because of lower gas prices Currently, EUA prices are trading at approximately 84.2 EUR/t.
Carbon market developments
There are several factors that drive carbon markets. In this section we dive into these dynamics. We start with demand for ETS allowances. Overall we think that demand for allowances will decline in 2026 for the following reasons.
First, the ample supply of LNG and mild weather conditions in Europe have contributed to the stabilization of European gas prices. Gas prices are currently reaching unusually low levels for this time of year. Simultaneously, fundamental dynamics in the carbon market have driven an upward trend in EUA prices. These developments have led to a shift in power generation from coal to gas, triggering a negative correlation between gas and carbon prices, as shown in the right chart above. More details on our energy markets outlook can be found . The use of gas compared to coal has resulted in lower demand for allowances. More on this under point 2.
Second, emissions from the power sector are important drivers for demand for allowances. Power sector emissions in the fourth quarter remain below historical averages, a trend expected to continue into 2026. In 2026, normalized weather conditions and expanding renewable energy capacity are projected to further reduce emissions and therefore lower demand for allowances. Lower gas prices and higher carbon costs are likely to make gas-based power generation more competitive compared to coal and lignite. Additionally, as renewables account for a growing share of energy production, gas is expected to play a crucial role in ensuring grid flexibility during periods of low renewable output, lowering further emissions and demand for allowances from this sector.
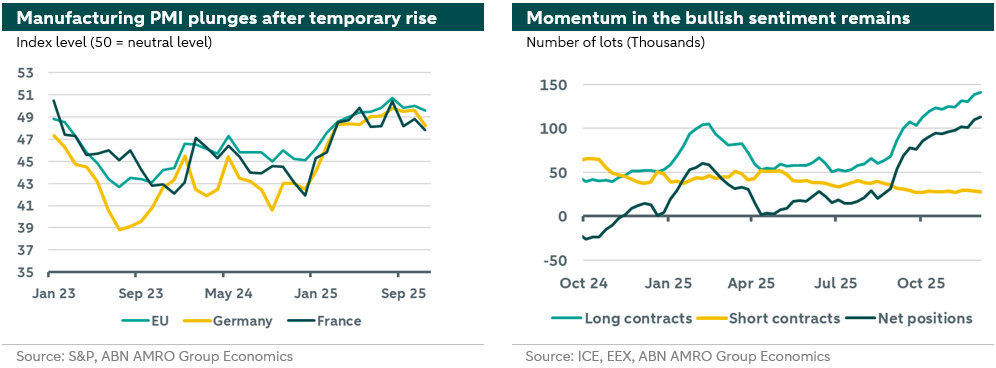
Third, industrial demand recovery in Europe continues to face obstacles. In November, the manufacturing PMI (Purchasing Managers' Index, as shown in the left chart below) declined again to 49.6 after briefly reaching the neutral 50 level in October. Business confidence remains weak across most eurozone countries, with growth hindered by a lack of new orders in major economies like Germany and France. The initial boost from stockpiling ahead of U.S. tariff implementation appears to be diminishing. However, we remain optimistic that Europe’s economic recovery will accelerate in 2026, supported by increased government spending on defense and infrastructure projects. On the downside, U.S. tariffs are likely to negatively impact the global economy, disrupting trade flows and shipping activity. This would reduce emissions from voyages to and from European ports, thereby decreasing demand for EU allowances in sectors like shipping and aviation.
Fourth, power sector emissions in the fourth quarter remain below historical averages, a trend expected to continue into 2026. In 2026, normalized weather conditions and expanding renewable energy capacity are projected to further reduce emissions. Lower gas prices and higher carbon costs are likely to make gas-based power generation more competitive compared to coal and lignite. Additionally, as renewables account for a growing share of energy production, gas is expected to play a crucial role in ensuring grid flexibility during periods of low renewable output, lowering further emissions from this sector.
Despite weaker demand there are even more important dynamics on the supply side that eventually result in higher carbon prices. To start, auction volumes are expected to drop significantly in 2026 partly due to the tightening of the emissions cap and the gradual phaseout of free allocations are reducing medium-term supply. Overall, there is an expectation of a significant reduction in allowance supply—around 180 million ton of CO2 year-on-year— which has emerged as a key driver of rising prices, pointing to a clear supply deficit in 2026. While there is some uncertainty to the final number of reduction due to factors related to new efficiency benchmarks for free allocations (yet to be published) and the timing of maritime allowance cancellations, the overall trend toward a supply shortage remains the base case unless there is an intervention by the commission by front loading the anticipated surplus expected beyond 2028.
Moreover, traders and compliance entities (companies that need to surrender allowances) are positioning early for upcoming market changes, driving increased hedging and speculative buying. The bullish momentum continues, with investment funds' net positions predominantly consisting of long contracts, as shown in the right graph above.
Regulatory developments
Next to demand and supply dynamics there are also other development that are important to the carbon market like developments on the regulatory front.
The European Union’s Parliament has approved revised measures to streamline the Carbon Border Adjustment Mechanism (CBAM). These updates aim to lower compliance costs and enhance reporting processes for importers. Additional details regarding carbon leakage risks, coverage of downstream products, and emissions calculation methods are expected before full implementation in 2026.
The European Union has finalized its 2040 emission reduction targets, aiming for a 90% reduction compared to 1990 levels. Of this 90% 5% will be achieved through carbon credits (which reduces expected demand for ETS allowances), effectively setting the target at 85%. The agreement also delays the launch of EU-ETS2 by one year to 2028 and introduces measures to manage price volatility and enhance price stability mechanisms. Key changes include allowing up to 80 Mt of allowances to be added annually if price exceeds the 45 EUR/t level (2020 real prices) until 2029, which well extends the MSR limits, and introducing a buffer zone for TNAC levels between 210 Mt and 260 Mt. Additionally, early auctions will begin six months before the launch, alongside a new front-loading facility to fund climate transition programs.
2026 Outlook
As 2026 approaches, there are several uncertainties surrounding supply. Free allocation benchmarks remain subject to change, and timing adjustments for shipping allowances have yet to be published. The EUR 20 billion REpowerEU target is set to be achieved by August 31, 2026, but there is a risk that the EU may delay Innovation Fund (IF) volumes, potentially reducing auction supply by approximately 21 Mt from June to August 2026. Additionally, details about Market Stability Reserve (MSR) injections starting in September 2026 have yet to be known. Additionally, the commission could opt for smoothing out the coming supply deficit through the front loading of future surplus, which would drastically change our outlook.
Taken into account all the above, we remain bullish for 2026, prompting an upward trend for our outlook for the coming quarters driven by mainly tighter allowance supply. The table below outlines our updated EUA price outlook for the next quarters. See more on long term projections and potential regulatory shift in the EU-ETS in our earlier publication .