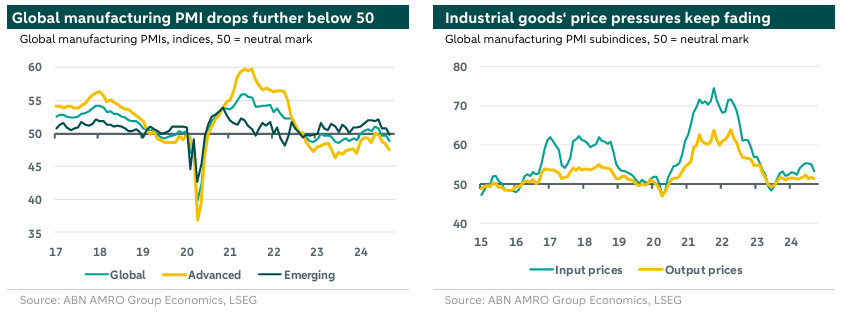
Contraction in global manufacturing deepens

Global manufacturing PMI slides further into contraction territory. A broad-based weakening. Industrial goods’ price pressures fade.
Global manufacturing PMI slides further into contraction territory
The slowdown in global manufacturing seen over the past few months deepened in September. After having risen to a two-year high of 51.0 in May, the global manufacturing PMI dropped back below the neutral 50 mark separating expansion from contraction in July. In September, the index moved deeper into contraction territory, falling by almost a full point to a 14-month low of 48.8. We have for long warned against too much optimism on the global manufacturing side, given our growth views for the key economies – with a soft landing in the US, only a modest pick-up after a year of stagnation in the eurozone, and growth in China still being weighed down by the property sector downturn. Recent and forthcoming easing measures in the US, China and the eurozone may well bring some upside to the outlook for global industry (also see our ). However, risks also loom in the form of a potential oil price spike if the Middle East conflict escalates further - a topic we will publish on later today.
A broad-based weakening
The further slowdown in global manufacturing seen in September was broad-based, with weakness still mainly concentrated in the developed markets (DM). The average DM index fell by 0.8 points to a nine month-low of 47.5 (August: 48.3). The average EM index dropped by a full point to 49.8, returning to below the neutral mark for the first time since January 2023 (August: 50.8). Amongst DMs, the weakness in the eurozone, and in particular Germany, remains striking (also see our comments ). Germany was already the underperformer for a long time, and in September the German manufacturing PMI dropped further to a one-year low of 40.6 (August: 42.4). This also drove the eurozone average down again, to a nine-month low of 45.0 (August: 45.8). The Dutch manufacturing PMI showed its first increase in four months, but remained below the neutral mark at 48.2 (July: 47.7).

Regarding EMs, the drop in the aggregate index was driven by Caixin’s manufacturing PMI for China, which fell by more than a full point to 49.4. However, this may overstate the current weakness in Chinese manufacturing a bit, as the alternative ‘official’ index published by NBS picked up to 49.8 in September – the first time since July 2023 that the NBS index is above Caixin’s equivalent. Meanwhile, the stepping up of monetary and fiscal easing in China may also support manufacturing going forward (see our recent for more background).
Industrial goods’ price pressures fade
Looking at the various components of the global manufacturing PMI, the demand side remains weaker than the supply side. On the demand side, the global orders subindex fell by 1.5 point to 47.4 (August: 48.9), the weakest outcome since December 2022. The global export orders component dropped further to an 11-month low of 47.5 (August: 48.4). On the supply side, the global output subindex slid back into contraction territory (for the first time since December 2023), dropping to 49.4 (August: 50.0). These developments are also still visible in our global supply bottlenecks index, for which an excess supply/demand metric is one of the key components. Our global supply bottlenecks index moved a bit further into “excess supply” territory in September. The flipside of this is that it helps keeping a lid on cost push price pressures stemming from global manufacturing. Container tariffs also continued their decline that started end July, after having moved up again in Q2-2024. All in all, the global manufacturing PMI’s components for input and output prices – bellwethers for cost-push factors in global industrial goods’ prices – eased further in September, and are still well below their peaks seen in 2021/2022.
