ESG Economist - Carbon prices will reshape steel economics
This analysis is a follow up from our analysis of 22 October 2025 on the most polluting steel processes and the trend in CO2 emissions from these processes. In the underlying analysis, we examine the impact of carbon costs on companies in the sector and through its various methods of steel production. With both analyses, we hope to provide companies in the sector and their suppliers with more insight into identifying potential risks and opportunities.

The impact of carbon costs via the ETS price is significant for emission-intensive and inefficient companies in the steel industry
Under the EU ETS, steel companies receive free emission allowances, in which the most efficient installations are being allocated with more free allowances than less efficient ones
Carbon costs are increasingly becoming a determining factor in the overall cost structure for steel companies
The most efficient companies under the EU ETS experience less financial impact than their less efficient counterparts
With a theoretic minimum emission reduction rate of 3% per year, the number of available free emission allowances from 2029 onwards may be much lower than the verified emissions for the sector as a whole at that time; thereafter, carbon costs will continue to rise
Introduction
The steel industry faces multiple challenges. Overcapacity is a structural problem and will not disappear anytime soon. This puts pressure on profitability. The relatively low – but also highly volatile – margins are causing uncertainty among many steel producers, which in turn is putting a brake on the necessary investments in areas such as sustainability and innovation. Policy measures therefore remain essential to maintain competitiveness, secure jobs and ensure the transition of the steel industry. Not only from the point of view of protecting the steel industry against unfair competition, but also to emphasize the urgency of reducing CO2 emissions.
This analysis is a follow up from our on the most polluting steel processes and the trend in CO2 emissions from these processes. In that analysis, we emphasised the importance of phasing out polluting processes for steel production and promoting green steel production. However, this is proving to be a complex task.
In the underlying analysis, we examine the impact of carbon costs on companies in the sector and through its various methods of steel production. First, we look at the balance between the verified emissions of the steel industry per country versus the free emission allowances they receive for this. We then provide insight into how the distribution of free emission allowances is regulated per steel company in the EU. In order to identify the exact impact of carbon costs on steel companies, we distinguish four different methods of steel production. We compare not only the primary route of steel production (the classic integrated “Blast Furnace-Blast Oxygen Furnace” (BF-BOF) route) and the secondary route of steel production (via the “Electric Arc Furnace” (EAF), or the recycling route), but also production with green hydrogen (H-DRI-EAF) and with natural gas (DRI-EAF). Finally, we show when the sector as a whole can expect the greatest impact in economic terms based on the trend in CO2 emissions from 2017 to the present (i.e. the post-Paris Agreement period). We end this note with a short conclusion. With both analyses, we hope to provide companies in the sector and their suppliers with more insight into identifying potential risks and opportunities.
Emissions steel industry and free allocation
Under the EU Emissions Trading System (EU ETS), the largest steel manufacturers surrender emission allowances annually based on their verified CO2 emissions. However, the companies in the sector also receive free allowances. The figure on the left below shows the balance between total verified emissions and total free emission allowances received per country. This shows that the bulk of verified emissions is on balance covered by the total free emission allowances.
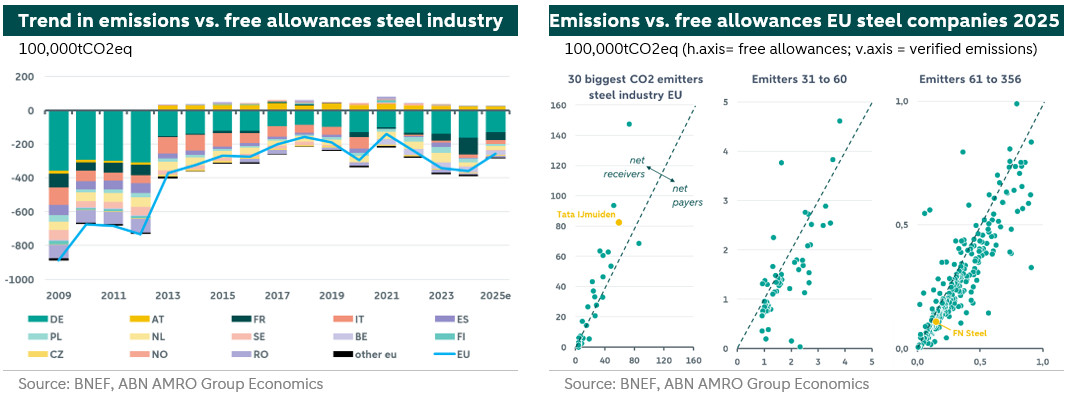
In the figures on the right above, we have plotted all EU ETS steel companies according to their verified emissions in 2025 (= vertical axis) and the free emission allowances (= horizontal axis) they receive, based on data from Bloomberg NEF (BNEF). The three graphs together show a total of 356 steel companies. The first graph shows the 30 largest CO2-emitting steel companies, and the following graphs show the other steel companies under the EU ETS. The companies to the left of each diagonal line receive more free emission allowances than their verified emissions. The steel companies to the right of this diagonal line receive fewer free emission allowances than they emit and must pay a premium for the surplus emissions.
To allocate the number of free emission allowances per steel company within EU ETS, product benchmarks are used. This involves calculating the average emission intensity of the 10% most efficient installations in the steel industry. Subsequently, all the EU ETS companies in the sector are compared with this benchmark. The free emission allowances are then calculated and allocated using a formula. Within the EU ETS system, companies may be eligible for more free emission allowances than they need. These are the companies that are less emission-intensive than average and therefore the most efficient. In this way, the pioneers with cleaner installations are supported. Steel companies with higher than average emission intensity must purchase additional emission allowances. The three figures on the right above show that many large emitters belong to the most efficient companies. These are mainly companies from the German steel industry, which consistently receive a significant proportion of the free emission allowances from the EU ETS each year. Tata Steel IJmuiden (the yellow dot in the first graph on the right above) also belongs in this manner to the category of most efficient companies. The other Dutch steel companies that fall under the EU ETS according to Bloomberg NEF data (FN Steel and Climax Molybdenum BV, see yellow dots in the far right figure) have to purchase emission allowances on balance and are therefore less efficient than the 10% most efficient once in the sector according to the EU ETS definition. This encourages in theory both companies to become more sustainable.
Cost structures steel production processes
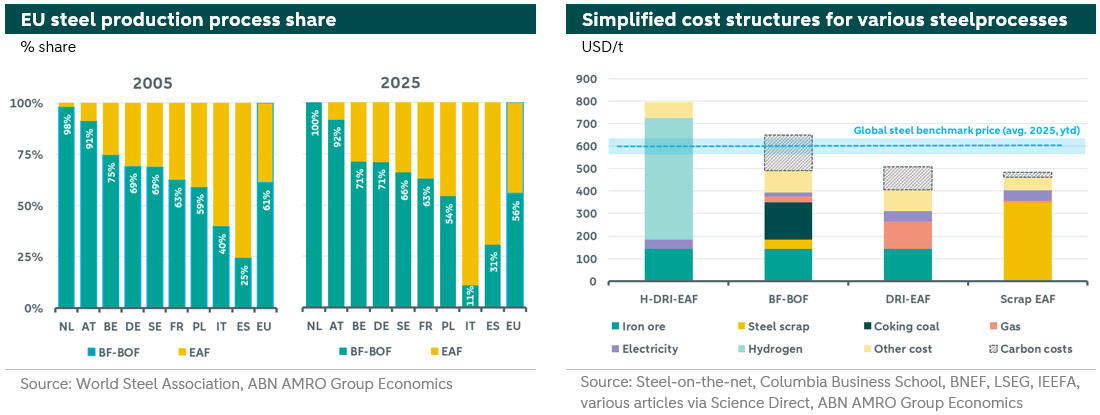
Our showed that the ratio between steel production via the BF-BOF route and via the EAF route can vary greatly from country to country. In the United States (US), for example, around 32% of total steel production is via the BF-BOF route, while the majority is via the EAF route. In China, the opposite is true. There, the bulk of steel is produced via the BF-BOF route, while only around 10% is produced via the less polluting EAF route. And in the EU, around 56% of steel is produced via the BF-BOF route in 2025, see also the figure on the left below. Twenty years earlier, this was 61%, so in this sense there has been no significant shift towards cleaner production methods. The figure also shows the distribution of production processes for the nine largest steel-producing EU countries.
The Netherlands has the highest share of BF-BOF of all EU countries. This share has changed little over the past twenty years. The production method used by Tata Steel IJmuiden has by far the greatest influence in this perspective. In the other major steel-producing EU countries, the shift over the past twenty years has been relatively small. Only in Italy has there been a major shift in favour of a cleaner method of steel production.Currently, the global steel sector accounts for approximately 8% of total CO2 emissions, but this could potentially double in the next ten years if steel producers fail to take action to accelerate sustainability. To make the steel sector low-carbon, installations can be equipped with carbon capture and/or biomass fuel facilities. However, the processes can also be completely replaced by another technology, such as the process of direct reduction with hydrogen (H-DRI-EAF). In recent years, this has become a promising method for decarbonising production in the steel sector. However, a major obstacle is the relatively high cost of hydrogen production, which makes the technology economically unviable. This is also evident from the figure on the right below. In terms of 2025 price levels, the cost of producing steel with hydrogen is higher than the average steel price.
In the short term, steel production based on green hydrogen is expected to remain limited. Various pilot projects and initiatives for steel production using hydrogen are underway worldwide, but these only account for a very small proportion of total capacity. However, data from LeadIT (Green Steel Tracker, 2025) shows that steel producers investing in sustainability are overwhelmingly opting to invest in hydrogen-based steel production. This indicates that this is the production process of the future. However, because supplying sufficient green hydrogen for the sector requires a huge upscaling of capacity. And this upscaling in capacity will take place as soon as there is sufficient demand. This egg-chicken problem also hinders a rapid breakthrough of hydrogen. According to Bloomberg NEF, the price of green hydrogen will remain stable (in nominal terms) in the coming years, mainly due to a further decline in the cost of wind, solar and electrolysis equipment in the coming years. This outlook fuels optimism among steel producers who want to invest in sustainability.
The cost structures of the BF-BOF route and the EAF route for the situation in the EU are also shown in the figure on the right above. There are numerous variants of both production methods, with a correspondingly wide variation in terms of environmental impact. For the sake of simplicity, this analysis is based on the classic BF-BOF route and two other variants of the EAF route: the ‘DRI-EAF’ using natural gas as fuel and the ‘scrap EAF’ using mainly electricity.
The BF-BOF route has raw materials (such as coking coal and iron ore) as its largest cost item. For the EAF route, which uses mainly scrap as its most important raw material, the cost of steel scrap is relatively high. Electricity costs also account for a large share here. However, local electricity tariffs, energy-saving measures and the availability of renewable energy sources have a major impact on total energy costs and thus on the production costs of steel. It goes without saying that the cost of natural gas is a significant factor in the DRI-EAF route. Ultimately, it is the carbon costs that will make the difference. In 2025, a total of 79 steel producers covered by the EU ETS are largely unaffected by carbon pricing due to their above-average efficiency and the surplus of free emission allowances they receive annually. The other EU ETS steel producers (277 in total in 2025) will feel the financial impact of carbon pricing. The difference in levels is shown in the figure on the right above. This shows that the classic BF-BOF route (without additional sustainability options, such as carbon capture) in the EU faces relatively high costs for greenhouse gas emissions compared to the other (EAF) routes. Because the production of steel with green hydrogen (H-DRI-EAF) has virtually no CO2 emissions, the carbon costs here are zero.
Carbon costs impact from 2029 onward
As higher carbon costs increase the risk of carbon leakage, the EU is implementing the Carbon Border Adjustment Mechanism (CBAM). Free emission allowances will be gradually phased-out alongside the phase-in of CBAM from 2026 onwards. This will help to secure to some extent a level playing field with countries outside the EU that have little or no carbon costs. The reduction in free emission allowances will take place in predetermined steps each year. This is shown in the figure on the left below for the steel sector (see yellow dotted line). The reduction in free emission allowances will be relatively swift, with a reduction of 48.5% in 2030. By 2034, the total amount of free emission allowances must be reduced to zero. As a result, emissions from steel production in the EU will gradually be ‘penalised’ between 2026 and 2034, thereby encouraging steel companies to become more sustainable.
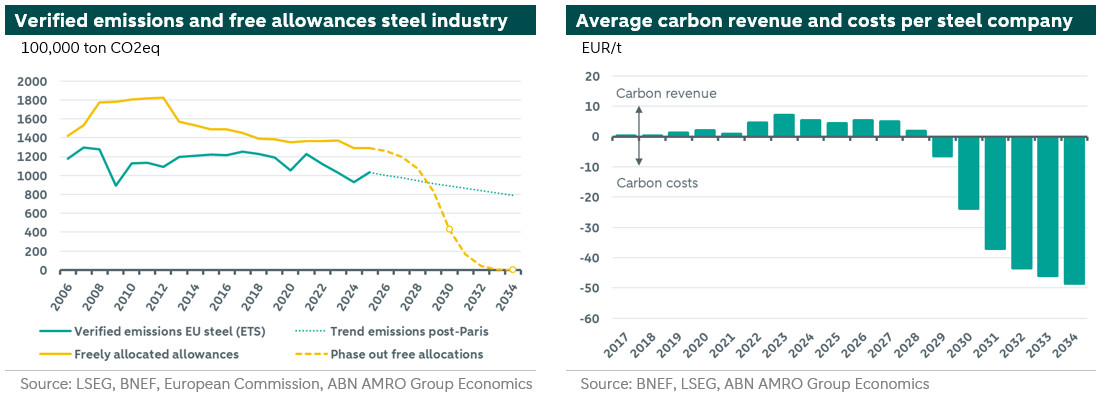
The actual path of verified emissions from steel companies under the EU ETS is shown by the dark green line in the above figure on the left. The dynamics of this trend are determined by the sum of the emissions of the underlying steel companies, with steel companies being added to and removed from the EU ETS each year. Over a period of twenty years, these CO2 emissions have decreased by 18%, which equates to an annual reduction in CO2 of almost 1%. In the period 2017-2024 (the post-Paris Agreement period), some acceleration can be observed, with the annual reduction in CO2 emissions averaging around 3%. We consider this to be the minimum possible annual emission reduction rate for the sector. If we extend this rate towards 2034, there will be a theoretical balance between verified emissions and free emissions from 2029 onwards. In the period from 2030 to 2034, in case the minimum emission reduction rate remains the same, the costs of carbon will continue to rise for the sector. This can be seen in the above figure on the right. This means that in the years up to 2029 steel companies should gear up investments in cleaner installations to avoid higher carbon costs.
Conclusion
The steel industry faces considerable challenges in terms of sustainability. Rising carbon costs under the EU ETS have a significant impact on emission-intensive and inefficient steel companies, while more efficient companies benefit from free emission allowances. A large proportion of companies in the sector are facing rising emission costs. It is therefore essential that the industry accelerates its commitment to low-carbon technologies, such as production with green hydrogen, in order to reduce CO2 emissions and remain future-proof in a changing economic context. Carbon costs will eventually become more important in the cost structure of steel companies. With an annual emission reduction of 3%, a balance between verified emissions and free emission allowances could theoretically be achieved from 2029 onwards. After 2029, carbon costs will continue to rise, further encouraging companies to invest in sustainability. All in all, stimulating government policy and investments (in hydrogen networks or electricity networks, for example) remain relevant to enable an acceleration in the sustainability of the steel sector.
(Photo by Ant Rozetsky via Unsplash)