ESG Economist - Industry’s pace of emission reduction needs to almost triple

The climate and energy crises have increased the importance of measuring sustainability in industry. Moreover, it makes sense to continue to closely monitor the impact of all kinds of climate measures taken by industrial companies. In particular, their impact on final energy consumption and ultimately greenhouse gas emissions in the sector. With this quarterly monitor, we give insight into the progress of sustainability in the industrial sector. We do this by monitoring various available sustainability indicators. Each quarter, we chart sustainable industry trends and developments. In the underlying Industry Sustainability Monitor (first edition), we discuss fossil energy consumption trends, the financial impact of fossil price trends in the Dutch manufacturing sector and show how energy consumption affects industrial greenhouse gas emissions.
Sustainability Monitor Dutch Manufacturing – Q2 2024
In the Dutch manufacturing sector, an annual average greenhouse gas reduction of 1.4% per year has been achieved in the post-Paris period (2017-2023), while at least 4% per year is needed
After the energy crisis in 2022, industrial gas demand is back on an upward trend, with particularly strong demand from the chemicals industry
Sharply higher fossil fuel prices in 2021 and 2022 greatly reduced industrial fossil consumption, but on balance, the total cost of fossil energy consumption was significantly higher
Our GHG emissions tracker shows a drop in emissions in 2023, mainly due to less final energy consumption, but the pace of reduction still falls short of what is needed to meet the 2030-goal
Goal industrial GHG emissions and energy mix
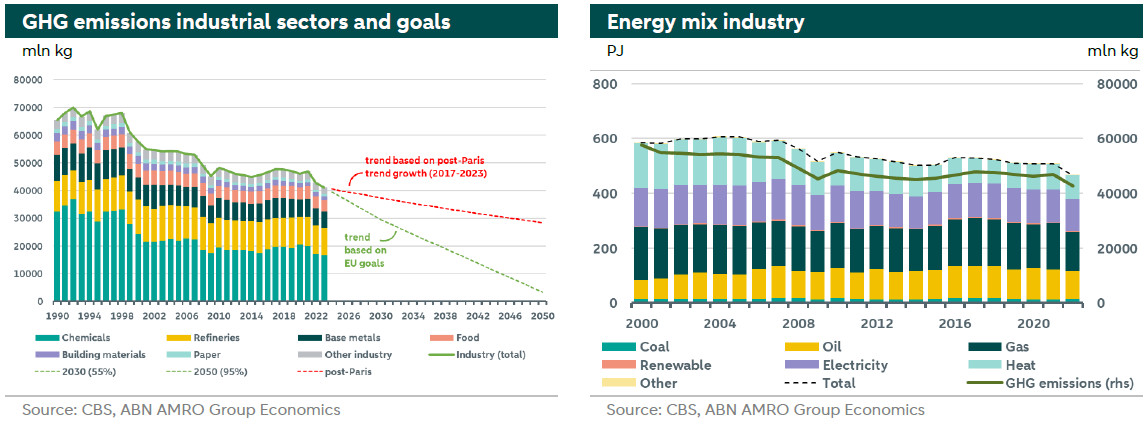
The EU's 2030 climate target - a 55% reduction in greenhouse gas emissions by 2030 compared to 1990 levels - is still a long way off for the Dutch economy. For the Dutch manufacturing sector, almost 30% of the current level of greenhouse gas emissions still needs to be reduced, or at least 4% per year. And that while in the post-Paris period (2017-2023) only an annual greenhouse gas reduction of 1.4% per year was achieved in this sector.

To reach the 2030 target, the pace in reducing greenhouse gases in industry would have to be accelerated. Stronger reductions in fossil fuel-based energy consumption are obvious in this respect, as there is a strong link between greenhouse gas emissions and fossil energy consumption. Of the total energy consumption in industry, fossil fuels account for about 55% in 2022. By investing more in fuel substitution and/or renewable energy production or by increasing energy efficiency, industrial companies can boost the pace of greenhouse gas emission reduction.
Fossil usage trend in industry
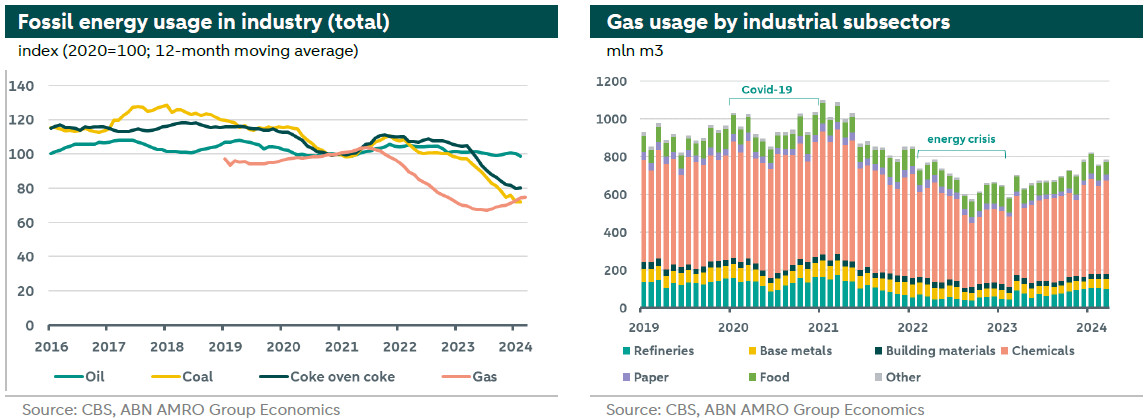
Fossil energy usage is still relatively high for oil, but dropped strongly for gas and coal. The decrease in coal consumption is mainly due to less business activity in the steel sector, while lower gas consumption was a result of the steeply higher gas prices during the energy crisis.
In Dutch industry, six subsectors are dominant in terms of gas consumption volumes. These are - in order of most gas consumption - the chemicals industry, the petroleum industry, the food industry, the basic metals industry, the paper industry and the building materials industry. Together, these six sectors account for about 95% of total industrial gas consumption. The chemicals industry accounts for almost two-thirds of gas consumption in the first quarter of 2024, followed by the petroleum industry (refineries) with 13% and then the food industry (10%).

Gas consumption has been increasing again in many subsectors in 2023 and early 2024. Gas demand increased most in the first quarter of 2024 in the petroleum industry (by 65% year-on-year) and in the chemical industry (by 25%). In the building materials industry, gas consumption fell by almost 20% year-on-year over the same period. However, the high gas consumption volumes seen before the energy crisis have not been reached. This was because the gas price was still at a relatively higher level. Despite the sharp drop in gas prices in 2023, the price is still higher before the energy crisis. In addition, even during the energy crisis, many industrial companies took measures to reduce their dependence on gas, which currently means that gas demand volumes are lower.
Companies can reduce energy consumption in a number of ways. In this perspective increasing energy efficiency plays an important role. For instance, screening industrial processes for energy consumption and better matching different processes can often prevent energy waste. The lost energy in some business processes (in many cases this is heat) can be recovered and used elsewhere in the process (or for heating rooms). The use of combined heat and power (CHP) can also improve efficiency, where a fuel (often a gas variant) can be used to generate both electricity and heat. Finally, the production process can also make greater use of secondary raw materials and recycling (such as scrap metal in the metals sector). Processing these secondary materials often requires significantly less energy.
Energy price trends and financial impact in industry
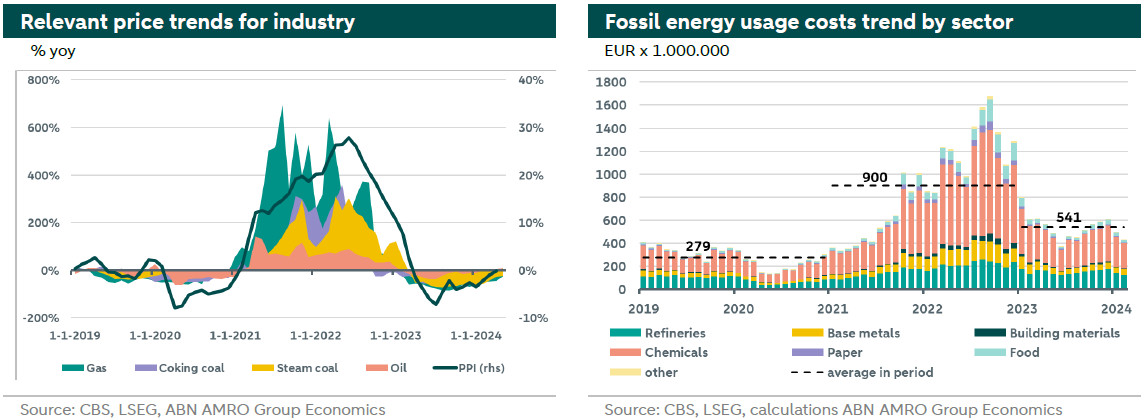
The pressure from the surge in energy prices in the years 2021 and 2022 was significant. This is reflected in the left-hand figure below, where we have plotted the relative change in energy prices against the relative change in the producer price index (PPI). In particular, it is the gas price that had a significant impact on the PPI, as gas is the most consumed in industry in terms of volume.
Relatively high gas prices have been a strong incentive for many industrial companies to rapidly reduce gas consumption and cut costs. The figure below right shows that the cost of fossil energy consumption increased sharply in 2021 and 2022. This led to a considerable rationalisation of fossil energy consumption considerably. After all, less energy consumption translates directly into lower production costs. But it also turned out to be a necessary choice from a competitiveness point of view. Indeed, higher energy prices for Dutch industrial companies weakens their international competitiveness vis-à-vis countries where energy prices were rising less sharply. And energy prices ended up rising faster in the Netherlands than in other countries within the eurozone (see our earlier analysis here). In this, the greater dependence on imports of fossil fuels plays a major role in particular.

Following the energy crisis and falling energy prices, the cost of fossil energy consumption decreased. Over the period 2023 and the first quarter of 2024, costs are down about 40% on average. But this has not yet provided the necessary relief. Because despite the sharp reduction in fossil energy consumption costs, costs are still over 90% higher on average compared to the period before the energy crisis.
Industrial GHG tracker
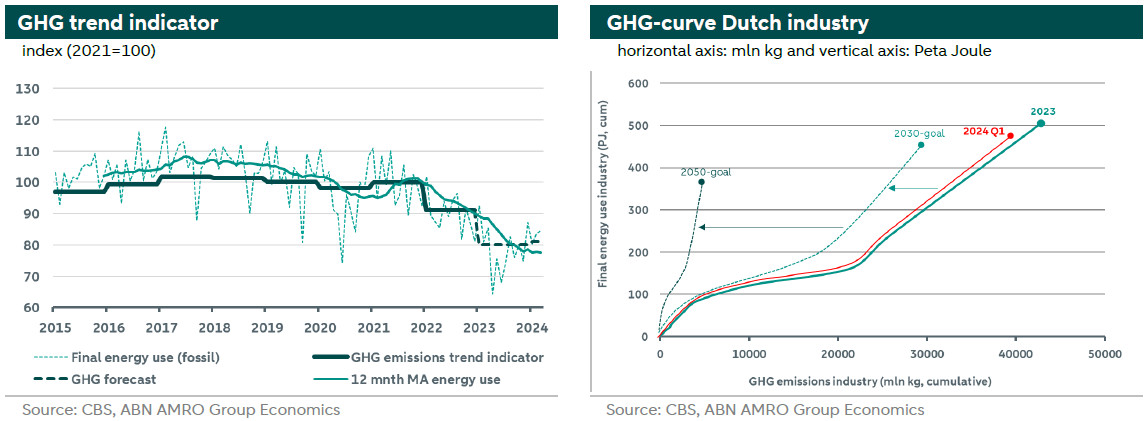
There is a strong relationship between industrial fossil fuel consumption and greenhouse gas emissions in industry (see left figure below). Here, fossil energy consumption is shown on a monthly basis (light green dotted line), to which is added the 12-month moving average (light green solid line). The figure shows the trend in industrial fossil energy consumption, to which we have added the annual greenhouse gas emissions by industry (until the year 2022), revealing the strong relationship and parallel in the trend between the two quantities. With this, the trend in fossil energy consumption ultimately gives a good indication of how industrial greenhouse gas emissions will develop for the year 2023 and early 2024 (Q1) (1). From this indication, we can conclude that after 2022, industrial greenhouse gas emissions are on a downward trend. Especially at the beginning of 2023, a strong dip can be observed. From 2024 onwards, fossil energy consumption is roughly flat year-on-year.

The GHG curve (see right figure) provides insight into final energy consumption (vertical axis, cumulative) compared with greenhouse gas emissions (horizontal axis, cumulative). Cumulative means that the final energy consumption and all greenhouse gas emissions of subsectors have been added together, resulting in one curve for the entire industry. The curve starts with the subsector with the lowest greenhouse gas emissions, which at the same time also has the lowest final energy consumption. After all, as a rule, the less fossil energy consumption, the less GHG emissions. The curve ends with the subsector with the highest emissions an energy use. By doing this, the GHG curve in the figure on the right is thus ultimately the sum of greenhouse gases of all subsectors and energy use, providing a picture for industry as a whole.
The GHG curve for the year 2023 is positioned on the far right in the right figure on the right (represented by the solid dark green line). The ultimate goal is for this GHG curve to move more to the left at a steady pace in the coming years. This means that the greenhouse gas emissions of the whole industry are decreasing, which can be seen on the horizontal axis: the more the position of the GHG curve moves to the left (as a whole), the lower the industry's greenhouse gas emissions. This is then a positive trend. In addition, the goal is to ultimately reduce also total energy consumption. This reduction can be read from the vertical axis in the figure. Here, the lower the end point of the GHG curve is in relation to the vertical axis, the less energy has been consumed. The decrease in energy consumption is relatively slow, around 1% to 2% per year. This is mainly due to an increase in energy efficiency. However, the level of energy consumption will remain relatively high going forward, since industry will continue to need a lot of energy in the future. As long as the energy mix of the future is predominantly green, greenhouse gas emissions will also eventually fall. In the transition, the share of fossil fuels needs to be sharply reduced in favour of renewable energy. The Netherlands has a target of around 70% of all electricity coming from renewable sources by 2030.
The 2030 and 2050 curves are the result of the EU's ambition. By 2030, GHG emissions must be at least 55% lower compared to 1990 levels, and by 2050 they must be at least 95%. This shifts the GHG curve as a whole further to the left over time. For energy, until 2030, total consumption decreases by 1.5 to 2% annually. For the period 2030-2050, energy consumption is reduced by around 1% annually. With these targets, the GHG curve eventually comes down from the vertical axis.
The GHG curve over 2024 (first quarter; see red line) shows where the industry currently stands. This GHG curve is the result of the relative reduction in GHG emissions in the first quarter of 2024 (based on the relative changes in the GHG emissions tracker, see left figure) and the relative reduction in energy consumption in the first quarter of 2024. The GHG curve over 2024 to Q1 is a fraction more to the left and a fraction lower compared to the 2023 position. So this means both a decrease in GHG emissions and a decrease in energy consumption. But - as we also noted earlier - the pace in reductions in industrial GHGs is still relatively slow, putting the 2030 target for industry in early 2024 still out of reach. The pace of the transition is now hampered by, among other things, limited grid capacity and its slow expansion, lack of qualified personnel, policy inaction and the degree to which a project can be economically financed. However, the emission reduction potential of low-carbon technologies can be high, once existing barriers are removed or lowered.
Our next Industry Sustainability Monitor will be published in early October 2024
(1) Our angle in this note is industry greenhouse gas emissions based on economic activity. These figures are only available from CBS on an annual basis and run through 2022. The 2023 figures will be released by CBS in November 2024. Quarterly industry figures are also available from the IPCC, but these are GHG emissions figures based on human activity. And besides, the industry sector is much more broadly defined in the IPCC figures. For instance, in IPCC figures, the industry sector includes water companies and waste management & construction.
