ESG Economist - Where are carbon prices heading this winter?

The EU-ETS is the flagship climate policy driving the transition of high emission sectors in the EU. There are several drivers affecting the European Union Allowance (EUA ) price both in the short and long term. We use our in-house data driven model to sketch the outlook for EUA prices for this winter under a baseline, upside and downside carbon price scenarios. The scenarios differ in the short term dynamics of supply, demand, weather conditions, and geopolitical uncertainty affecting energy prices and economic activity. We expect EUA prices is to range between 64 and 73 €/tCO2 under the baseline scenario and have a range of 72-80 €/tCO2, and 45-61 €/tCO2, under the upside and downside carbon price scenarios, respectively.

Giovanni Gentile
Fixed Income Strategist
Introduction
The EU-ETS is the flagship climate policy driving the transition in the European Union in sectors with high carbon emissions. The EU-ETS has gone through many phases since its establishment in 2005. We are currently in phase 4 which will last until 2030. The EU-ETS follows a cap-and-trade system, which means that a cap on emissions is set and reduced over time at a certain fixed percentage (the so-called linear reduction factor). The cap is further translated into emission permits, each of which represents the right to emit one ton of CO2 into the atmosphere. These permits are allocated to different installations either for free or through auctions in primary markets. Subsequently, the permits can be traded in secondary markets. Accordingly, the supply of permits is managed by the European commission, while demand comes from installations aiming to cover their emissions. Supply and demand forces would determine a clearing price for the permit market, namely the European Union Allowance (EUA) price. You can read our previous note here for a comprehensive overview on EU-ETS.
The developments of the EUA price in the future is of utmost importance for many stakeholders engaged in the carbon market, whether for trading purposes or for covering emissions. It is also an important factor governing the speed at which the transition takes place in covered sectors, where higher EUA prices would increase the feasibility of investing in low carbon technologies. However, there are many drivers affecting the EUA price each of which represent a source of uncertainty to the market, both in the short and long term.
In this note, we start by providing an overview of the main drivers of the EUA price in the short term before introducing our in-house short-term carbon price model and its main structure. We further deliver forecasts for EUA price developments under three short-term scenarios: a baseline, as well as upside and downside carbon price cases. We end with our outlook for gas and carbon prices for this winter. In subsequent research, we plan to present a long-term model for carbon prices.
EU-ETS price determinants
The EU-ETS originally covered emissions from heavy industry (steel, cement, aluminium), power generation, and aviation. Starting 2024, the scheme was extended to include emissions from maritime shipping with a gradual phase-in across three years.
Supply of emission permits is determined by the European commission and is allocated either for free or through an auction mechanism. Supply is reduced yearly at a linear reduction factor of around 4.2%.
Demand on the other hand is affected by multiple factors both in the short and long term. In the long term, deployment of renewables and low carbon technologies determine the transition speed and emission trajectory from the covered sectors. While short term drivers are those linked to energy markets, weather conditions, and economic activity. For our purposes in this note, we focus on the short term drivers.
Fossil fuels are the main source of emissions. Sectors use different kinds of fossil fuels. For example, oil is mostly used in the transportation sector, while coal and gas for power generation. Gas is also the main source for heating purposes and industrial operations. These fuels have different emission intensities across sectors. In general, coal is the most carbon intensive fuel, followed by oil and gas, respectively. Accordingly, demand for emission permits is affected by the prices of these fossil fuels. Overall, a decrease in fuel prices would motivate their usage and, in consequence, increase demand for permits to emit carbon. At the same time, there is also a price substitution effect between different fossil fuels that are used for the same purpose, which affect demand for EUAs accordingly. The most important substitution effect for EU-ETS is between gas and coal in the power sector. That is, if gas prices become relatively more expensive compared to coal, coal become more viable to use for power generation, inducing higher demand for carbon (emission intensity is higher for coal), and vice versa.
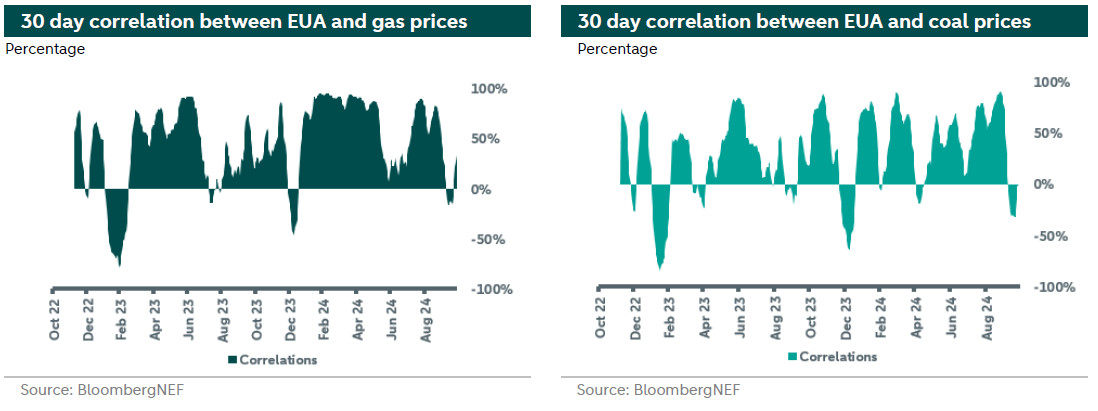
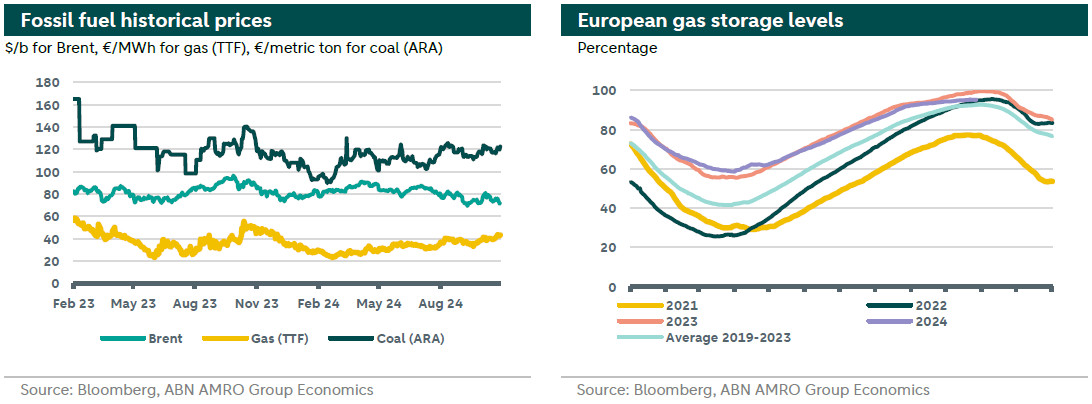
During the past year, the EUA price was highly driven by gas prices. The 30-day correlation between the two exceeded 90% in some days, as can be observed in the chart below (left). Gas prices in turn were driven by several factors, such as weather conditions and disruptions in the pipeline supply (mainly from Norway) or LNG markets. Furthermore, gas prices depend on storage levels especially during the winter season, as it provides a buffer for supply disruptions, giving the market some relief.
Weather conditions affect the carbon market through their impact on energy markets. For example, lower wind speed or cloudy skies would decrease renewable output and would require more power generation through conventional fossil based sources. In addition, cold spells and heat waves increase gas consumption for heating and cooling purposes, increasing demand for EUAs.
Shocks and economic surprises also affect carbon markets through its impact on economic activity. With slower economic activity, there will be less industrial output and lower demand for emission allowances.
EU-ETS market status
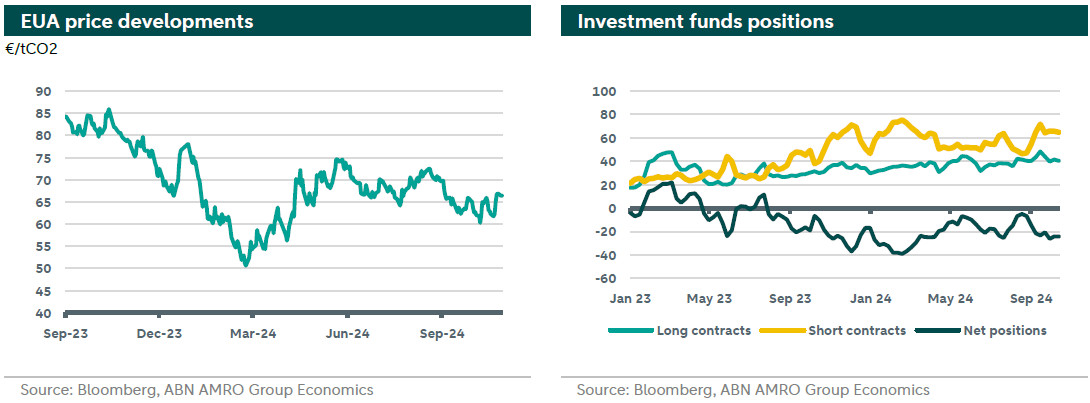
EUA prices have been relatively stable over the last month, fluctuating between 60 and 67 €/tCO2, averaging around 64.4 €/tCO2 since the beginning of September. Prices witnessed a modest rise around the surrender date on the 30th of September. Tensions in the Middle East and fears of supply disruptions also pushed prices upward in October, through its impact on energy markets. Demand from main sectors remains weak given the weakness in the industrial sector, mild weather, and high renewable energy output. The bearish sentiment is still dominating the market. EUAs were trading around 65.4 €/tCO2 at the time of writing.
The responsiveness of EUA prices to developments in the gas market regained momentum this week compared to the last few weeks. Gas prices have been moving higher following an unplanned maintenance in Norway, however, high gas storage levels (95% full) are keeping a lid on prices. The de-escalation of tensions in the Middle East led to a fading of the geopolitical premium for gas prices and as a consequence carbon prices.
Demand from industry also continues to be weak, with the European industrial sector remaining in the doldrums. The eurozone is still an underperformer with the manufacturing PMI remaining firmly in contraction territory in October. Forward looking indicators also remain depressed. Accordingly, a recovery in industrial carbon demand is not expected before the turn of the year.
From the supply side, the market is experiencing a surplus driven mainly by the front-loading of allowances to fund the REPowerEU packages and the additional allowances put in the market following the extension of EU-ETS to the shipping sector. Accordingly, the total supply of permits for the year is shrinking by just 1%, which is significantly lower than the linear reduction factor of 4.3%. We note that the current frontloading implies that stronger reduction in circulated permits is expected between 2025 and 2030. This, in turn, indicates that higher EUA prices can be expected in the coming years.
Short term model for carbon prices
To model EU-ETS prices, we start by considering the variables that help determine its price. In our initial approach, we compiled data on key variables such as fossil fuel markets, weather and economic activity. Other variables with potential explanatory power were also considered, such as iron and steel prices and equity volatility. The idea behind this approach was to start with a large set of variables and use quantitative techniques to select the most relevant determinants.
During the first modelling attempts, a key issue was raised: the presence of persistent multicollinearity in the data - that is, heavy correlation between the independent variables. As previously discussed in this note, the latest market trends indicate an increasingly strong relation between natural gas and EU-ETS price. At the same time, natural gas acts as a medium for the effect of other variables on carbon prices. The clearest example is with the weather data effect. A colder temperature for instance has a direct effect on the demand for gas, which translates into higher demand for allowances, affecting EU-ETS prices. The indirect effects being channelled through gas were multiple. To solve for the elevated multicollinearity and to account for the more direct effect fossil fuel prices have on the carbon prices, a two-step modelling approach was adopted. The modelling architecture combines two separate models; one for natural gas and one for EU-ETS prices, as illustrated in the final model structure below:
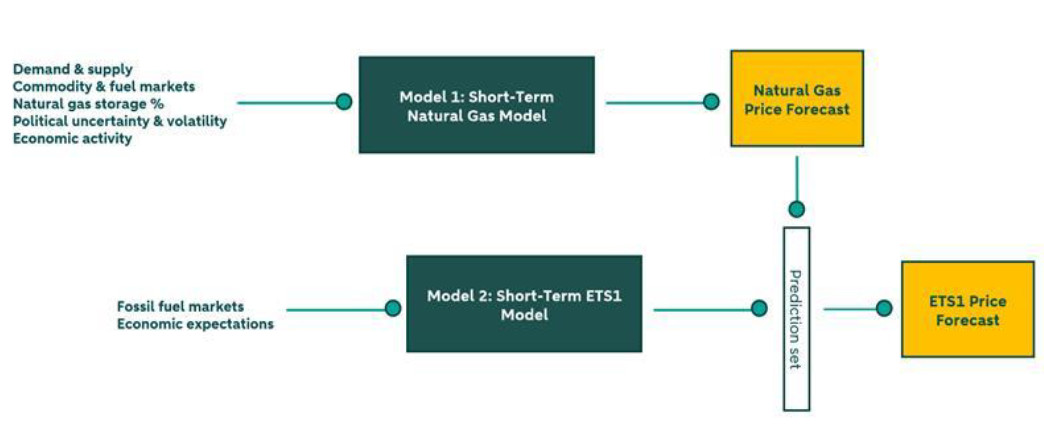
The natural gas model considers variables that influence EU-ETS prices indirectly by measuring the direct effect on gas itself. It considers demand and supply, commodity markets and the natural gas storage percentage. The model also accounts for political uncertainty and economic activity. These variables have a direct impact on the gas price.
The indirect impact on carbon price prices is then assessed through the use of a second, EU-ETS specific model. This model contains direct determinants of carbon prices, mainly fossil fuel prices. The model is built on the basis of machine learning techniques, relying on daily data from as far back as 2010. The modelling architecture allows to account for multicollinearity by separating indirect from direct determinants of EU-ETS prices.
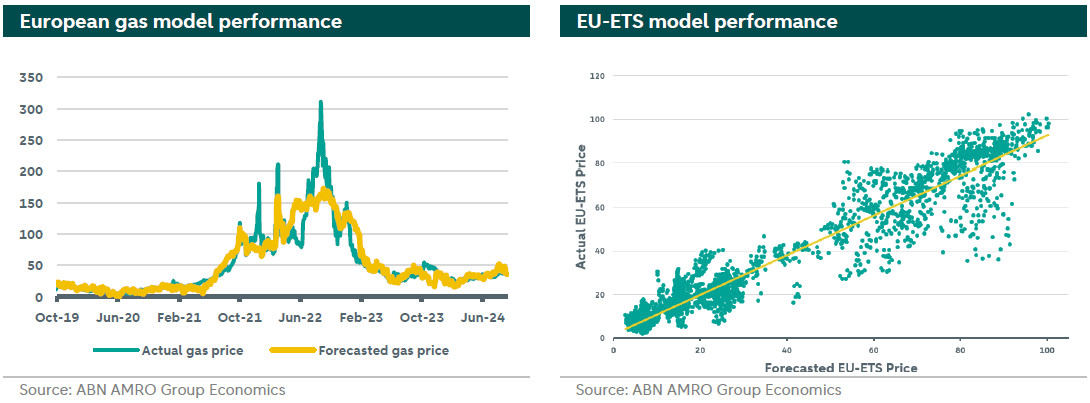
Another key aspect of the short-term model for EU-ETS prices is non-linearity. Relationships between variables, such as natural gas and carbon prices are non-linear, making a simple linear regression model unapplicable. The above architecture accounts for non-linearity and these complex, dynamic relationships. A summary of model parameters and performance can be found in the Appendix.
EU-ETS scenarios for Q4-24 and Q1-25
In this section we present the narrative for our scenarios for the upcoming months covering the winter season (November 2024 – April 2025). We sketch three scenarios, namely: Baseline, upside, and downside carbon price. These scenarios are differentiated in their assumption on several factors driving the model forecast as explained below.
Baseline scenario
Our baseline scenario assumes a business as usual environment where fossil fuel prices follow the fundamentals in the corresponding market. Economic activity remains relatively muted. While weather forecasters predicts this winter to be colder than the last two years, we take the three-year average as a predictor for temperature in this scenario. For gas demand and supply, and in order to capture any efficacy improvement or recent structural demand shifts, we use the monthly average of the last two years. Finally, we assume no disruptions in gas supply in the forecast horizon, and gas storage levels to follow the path of last year.
Upside carbon price scenario
This scenario reflects the state of carbon markets under high uncertainty and adverse conditions for economic activity and energy markets. These conditions could be driven by geopolitical risks such as a wider escalation in the Middle East, which affect adversely all fossil fuel markets. The scenario also assumes high level of uncertainty in the markets inducing a large deviation in market predictions compared to reality. Additionally, weather conditions are assumed unfavourable, with colder winter compared to the baseline scenario. Accordingly, gas demand is assumed 10% higher than that in the baseline scenario. European gas supply is assumed disrupted by unplanned maintenance in Norway or due to resurgence of geopolitical risks affecting negatively the LNG market, which decrease supply by 5% compared to the Baseline scenario. All these conditions would increase gas consumption and depletes storage faster at higher levels. Offsetting these upward impacts for EUA prices, the economy performs worse than expected in this environment.
Downside carbon price scenario
This scenario represents the situation of the carbon market with low uncertainty and more favourable conditions compared to the Baseline case. That is, under this scenario we assume no economic shocks or escalations in geopolitical tensions, mitigating any premium in fossil fuel markets. We further assumes a milder winter in comparison with the baseline scenario, which would make gas demand 10% lower than the baseline. Gas supply is assumed 5% higher, which would make storage levels to remain higher than average during the winter time. Offsetting these downward impacts for EUA prices, the economy performs better than expected.
Outlook
In this section we present our forecast under the three above mentioned scenarios. The charts below summarize our results. The left hand chart depicts the outlook for European month-ahead gas prices. Under the Baseline scenario, gas prices increase initially, but as we get to the middle of the heating season, they start to decline towards 36 €/MWh before rising again as reach the end of the winter. Prices under the upside scenario follow as similar trend but on a higher level, where gas prices range between 48 and 55 €/MWh in the coming six months. In contrast, gas prices follow a decreasing trend under the downside scenario, reaching 24 €/MWh in April 2025.
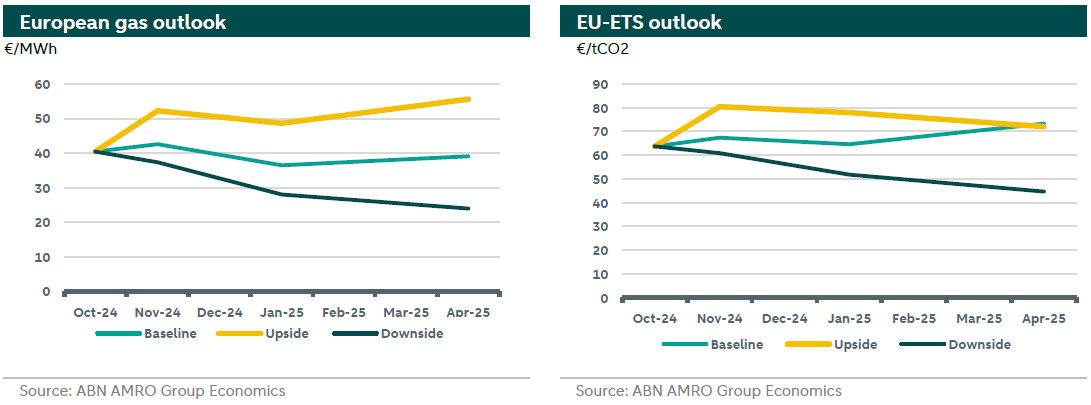
On the other hand, our forecast for EUA prices under the baseline scenario decrease towards 64 €/tCO2 after a brief initial increase. The price reaches 72 €/tCO2 by the end of winter. Under the upside carbon price scenario EUA reach 80 before decreasing gradually to 71 levels by the end of April. Finally, under the downside scenario, EUA prices show a downward trend towards 46 €/tCO2.
Appendix
European natural gas short-term model
Description: Ordinary Least Squares (OLS) Regression with European natural gas price as the dependent variable and several regressors capturing demand, supply, imports, storage levels, geopolitical uncertainty, energy and financial markets, and economic activity. The model runs on historical daily data with a total of 28406 data points.
Multicollinearity: All variables with Variance Inflation Factor (VIF) under 10.
Heteroskedasticity: Model contains robust standard errors to fix for non-constant variance.
Statistical Significance: All variables under 0.05 p-value, 95% confidence interval.
Accuracy and Performance: 0.857 Adjusted R-squared.
EU-ETS short-term model
Description: A Support Vector Machine model with EU-ETS Price as the dependent variable and fossil fuel prices and economic expectations as explanatory variables. A non-linear Support Vector Machine (SVR) model predicts continuous values by identifying complex patterns in data that go beyond simple straight-line relationships. It captures intricate connections between inputs and outputs, making it ideal for scenarios where relationships are more complex, like predicting stock prices or weather changes. This flexibility allows it to model carbon price data with higher accuracy in complicated situations.
The model runs on historical daily data with a total of 15460 datapoints.
Model robustness and cross validation: K=10 validation, with R-squared scores: 0.94, 0.90, 0.91, 0.93, 0.93, 0.92, 0.95, 0.93, 0.93, 0.93, Standard Deviation of R-squared scores: 0.0114.
Accuracy and performance: 0.928 R-squared.
