ESG Strategist – EU ETS costs will not eat into company’s profits

In this note, we analyze the impact of increasing ETS prices on companies’ results from the sectors under EU ETS and EU ETS2. According to our results, the impact on the electricity sector is quite benign, especially if we consider that the cost pass through is limited to 42%.


In the shipping sector, we expect that the ETS costs will represent only 9% of EBITDA by 2030. The impact is negligible if we consider the sector's potential ability of passing-though nearly all costs
In materials, companies that operate in “high-risk” sectors receive 100% of free allowances. However, even if that would not be the case, the impact of ETS costs on EBITDA would be limited to 7% in 2030
Aviation is an exception, where we conclude that the sector’s limited ability to pass-through costs to consumers coupled with a limited expected emissions’ reduction over the coming years will imply that ETS costs could represent as much as ~50% of EBITDA by 2030
Finally, with regards to fossil fuels, ETS-2-related costs are expected to represent an average of 1.5x EBITDA by 2030. However, we expect companies to be able to fully pass-through these costs to end-consumers
As such, the direct ETS impact will be mostly spread out across the economy, implying that companies will be mostly impact through second-round effects
The EU Emissions Trading System (EU ETS) is an initiative launched at the EU-level in 2005 aimed at putting a carbon price on the greenhouse gas (GHG) emissions of certain sectors, as well as capping emissions for those companies on aggregate, with the cap steadily declining over the years. A lot of research has been conducted already on the potential impact of EU ETS on companies / sectors. For example, in a previous piece, we showed that sectors under the ETS decarbonize faster (see here). However, with rising carbon prices (more on this below), it remains unclear to what extent will entities regulated by the EU ETS be negatively impacted by it. More specifically, whether the reduction in carbon emissions and profits growth will be enough to offset the expected increase in carbon prices. As such, we aim to investigate this issue in this note.
A brief overview of the EU ETS
The EU ETS works as a “cap and trade” system, implying that the EU sets the limit for total amount of GHG emissions allowed to be emitted on aggregate and companies have the option to sell (purchase) their surplus (deficit) emission rights on secondary markets. The cap set under the EU ETS is reduced annually, in line with the EU’s climate target and ensuring that overall EU emissions decrease over time. As shown in the right-hand chart on the next page, over the years, the emissions from the companies operating under the EU ETS have been lower than the emissions cap.
Since 2013, the EU ETS works with free and auctioned emission allowances. That implies that certain sectors have the right to emit for free. The idea behind this is to enable companies within these sectors to compete outside of the EU, where entities are subject to less strict climate legislation. Over time, however, also these sectors will transition to full auctioning.
With the reduction in both free allowances and caps, it is estimated that the EU ETS price will also increase over time. For example, Bloomberg NEF estimates that this price will jump from EUR 67/tonne in 2024 to EUR 147/tonne in 2030 (see chart on the right on the next page).
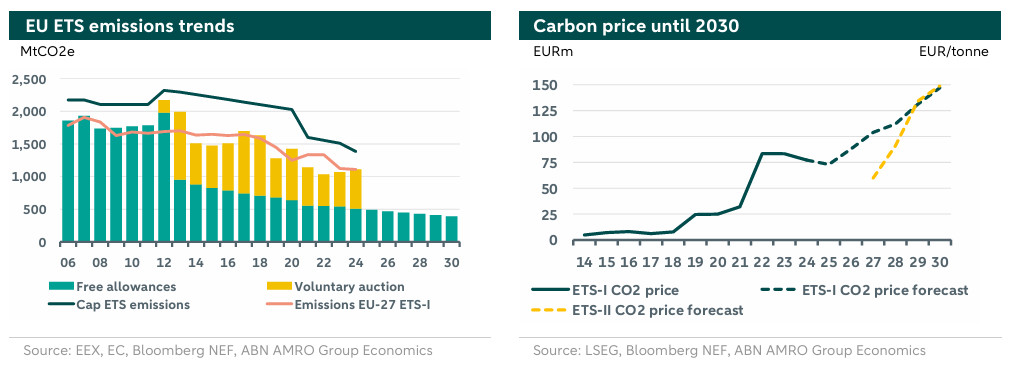
The EU ETS has so far been targeted at companies within the sectors of electricity generation, aviation, heavy industry (such as oil refineries, steel works, production of iron, aluminium metals, cement, and so on, which we call the “materials” sector in this piece), and, most recently, international shipping. The remaining combustion emissions will be addressed in an upcoming system named as EU-ETS2. The EU-ETS2 will be fully in place as of 2027, and will apply to the emissions from road transport, buildings, and other light industry sectors. The emissions covered by the EU-ETS2 will be upstream, implying that fuel suppliers, rather than end consumers such as households or car users, will be the regulated entities.
Bloomberg NEF forecasts EU-ETS2 carbon prices to be lower than under the ETS already in-place in its first years, up until around 2029, when prices begin to align (see right-hand side chart above). The reason for that regards the difference in supply and demand dynamics for the sectors under the EU-ETS2.
Estimating the impact of ETS into company’s profitability
For each sector under the scope of EU ETS, we obtained the top 20 European companies based on market capitalization. For each of these companies, we gathered EBITDA and Scope 1 GHG emissions between 2019 and 2024. Our forecast up until 2030 is based on historical compound annual growth rates (CAGR) for both EBITDA and emissions over that period. We apply the EBITDA CAGR over the EBITDA net of ETS costs in order to avoid double counting the impact of ETS cost in total EBITDA. In terms of emissions, since the EU ETS is only applicable to emissions realized in Europe, we adjust our emission forecast to only account for the company’s operations in the EU. For that, we have used as proxy the share of each company’s revenues in Europe (as per 2024). We note that although the UK is not part of the EU ETS scheme, the UK also has its own ETS system named UK ETS. As such, given that companies operating in that region also have to pay for their carbon emissions, we included UK when calculating the share of operations in the EU.
For EU-ETS2, we followed a similar approach, but with one caveat. This system will cover emissions from road transport, buildings and small industry, and fossil fuel suppliers will be the ones responsible for handling the allowances from the fuel they sell. As such, for this sector, we selected the top 20 European fossil fuel companies and, instead of considering Scope 1 GHG emissions, we gathered the emissions under Scope 3 (Category 11: Use of Sold Products).
Once we have calculated expected EBITDA and European emissions for all the companies in our sample, we also take into account that not all emissions are subject to the ETS costs, as some emissions fall under the free allowances scheme. As such, we also adjust our yearly emissions forecast to account for the pathway of free allowances for that specific sector. This ensures that we only apply the ETS prices to the share of emissions in Europe that are not covered by free allowances.
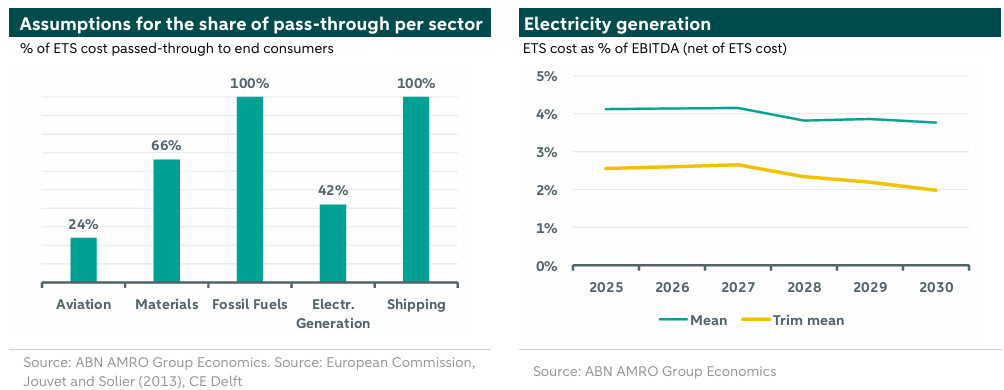
Hence, for each sector, we also need to define a yearly pathway for free allowances. Regarding shipping, 60% of 2024 emissions receive free allowances, evolving to 30% for 2025 and 0% for 2026 emissions. For the electricity generation sector, we account for the fact that some EU Member States can provide free allocations, but may choose not to do so as per Article 10c (). As such, in order to calculate the sector’s share of free allowances we conduct the following calculation: firstly, we identify which Member States are offering free allowances and what is the corresponding share of free allowances; secondly, we weight each of these Member State’s share of free allowance by its contribution to the overall EU GDP and thirdly, we combine these weighted shares to arrive at a weighted average share of free allowances for the electricity sector of 98.6%. For the Materials sector, companies operating at a sub-sector classified as having a higher risk of relocating their production outside of the EU (carbon leakage) receive 100% of their allocation for free. For less exposed sub-sectors within Materials, free allocation is foreseen to be gradually phased out after 2026, from 30% to 0% by 2030. Finally, the aviation will have a gradual phase-out of free allowances, which will be reduced by 25% in 2024 and by 50% 2025 (vs. 2023 levels). Free allowances will be fully phased out by 2026. The summary of our expected share of auctioned allowances subject to the ETS price is shown in the left-hand chart below.
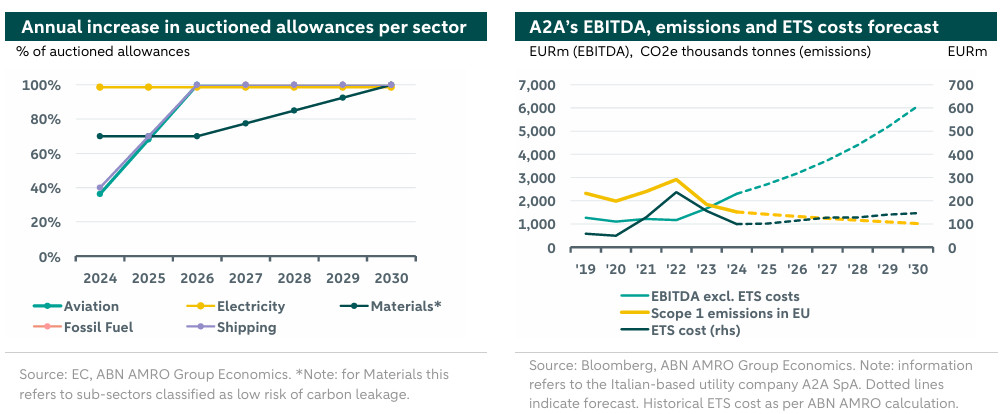
Finally, we calculated the impact of ETS costs on companies’ EBITDA for the period 2025-2030 (EU ETS) and 2027-2030 (EU-ETS2). Our forecast is also dependent on estimations for the EU ETS price. As we have shown on the chart on page 2, we use Bloomberg NEF estimates for both EU ETS and EU-ETS2 prices. In order to assess the impact of the EU ETS cost for companies, we mainly look at the share of ETS costs over the total EBITDA excluding the ETS costs. An example of how the calculations were performed is presented on the right-hand side chart above. We note that we also present the trimmed average by excluding the top and bottom 10% of our sample in order to adjust for outliers (for example, in the aviation sector, some European airlines are relatively small and/or have negligible EBITDA growth rates, implying that EU ETS costs represent a significant share of their EBITDA). Results are presented below.
A first analysis of the charts above indicates that:
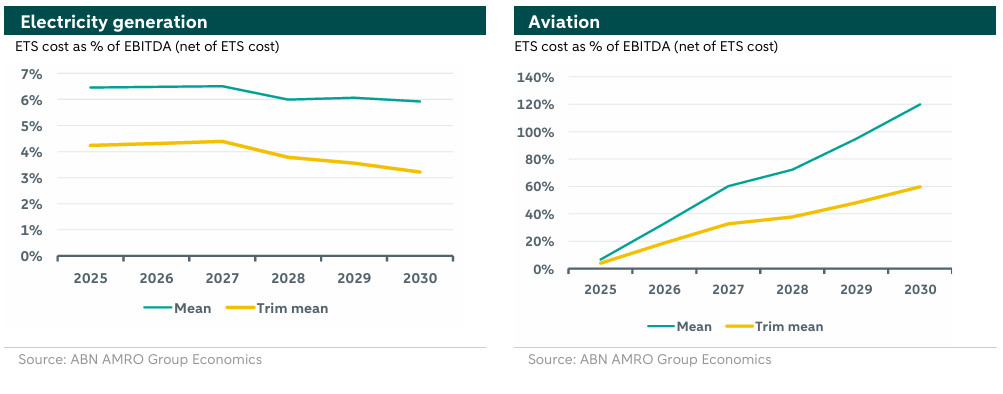
The impact of EU ETS costs over time is relatively stable for the electricity generation sector, and that is mainly attributed to the combination of EBITDA growth and emissions reduction over time (see chart on the top of the previous page). Hence, these elements are enough to compensate for the higher ETS price over the years.
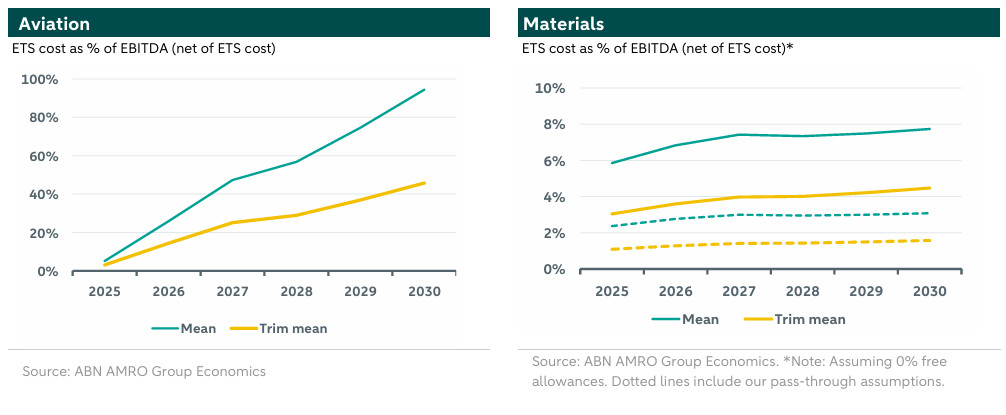
The aviation sector is very vulnerable mainly due to the phase-out of free emission allowances by 2026. Furthermore, this sector has on average experienced a growth in emissions over the years, attributed to several factors such as a rise in air cargo demand driven by the growth of e-commerce and supply chain shifts, as well as to the use of more short-haul routes (which tend to be less fuel efficient) to recoup losses made during the pandemic. We note that some companies do not report emissions before 2022/2021, which implies that in some cases, our estimate for emissions growth could be attributed to airlines slowly resuming operations after a slowdown following Covid-19. Nevertheless, overall, we see a trend that the aviation sector’s emissions growth has outpaced the EBITDA growth during the analysed period. The combination of this with higher carbon prices and the ending of free allowances results in a significant increase of how much ETS costs represent as a share of EBITDA (rising from 4% in 2024 to nearly 60% in 2030).
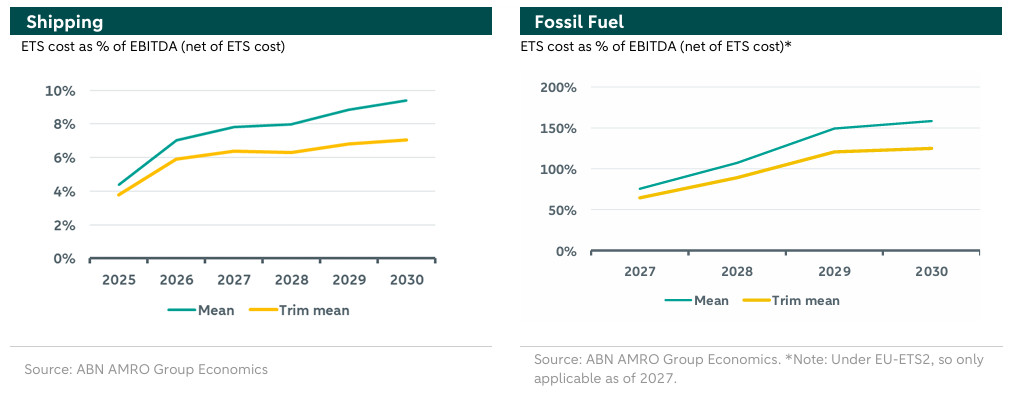
According to our analysis, ETS costs will not constitute a major portion of shipping companies' earnings compared to other industries, projected to reach 4% of EBITDA in 2025, 7% in 2026, and 9.4% in 2030. A stable path for emission reduction alongside consistent EBITDA growth could help mitigate rising carbon prices and reduce the adverse impact of ETS on profitability. It is important to mention that shipping companies are also subject to the IMO penalty price, which we do not consider in this analysis. Nevertheless, even when also considering the IMO price, the marginal abatement costs for alternative fuels to decarbonize a hard-to-abate sector such as shipping remains higher than the anticipated carbon-related costs, leading shipping companies to prefer paying the ETS price and the IMO penalty price despite a potential negative impact on profits (read more here).
For fossil fuel companies, we study the impact of ETS costs from 2027, given that the system is expected to be fully operational from that date. These companies will be severely impacted by the ETS, in particular after 2028 when we expect the ETS costs to actually surpass EBITDA. Even with a forecast of rising EBITDA and decreasing emissions, these factors will not be enough to compensate for the increase in ETS prices, which is expected to more than double from 2027 to 2029 (from 60% to 134%, as depicted in the graph on page 2).
We did not plot the materials sector above, given that this sector receives 100% free allowances due to the high risk of relocating their production. However, if we would look at a scenario in which these companies do not receive any free allowances, we observe that the ETS costs impact on EBITDA would be relatively stable and limited over time, growing from 6% in 2025 to 8% by 2030 (see bottom right-hand chart on the next page). For this sector, as it is the case for the shipping sector, a stable emission reduction path, together with a steady EBITDA growth, would compensate for the increasing carbon prices and limit the negative impact of ETS on profitability.
We also note that across all sectors operating under the EU ETS1, there is a small decrease in the share of ETS costs of EBITDA in 2028. That is due to the fact that the annual pace of increase in ETS prices becomes less significant in that year. That is, in 2028, ETS prices are forecasted to increase by only 8%, compared to an average 20% rise in 2026 and 2027. After that, however, ETS prices return to their ‘normal’ growth rates, which explains the resulting increase in the share of ETS costs for 2029 and 2030 (please refer to our pathway for ETS prices shown on page 2).
Pass-through of costs may provide additional relief
Finally, one big limitation of our analysis is that we assume zero cost pass-through of the carbon costs to end consumers. That is, at this point, we assumed that EBITDA grows as per historical rates and that therefore revenues do not account for potential changes in costs or pricing strategies that could result from the higher carbon costs. As such, in this section, we adjust our previously presented results by reducing the total ETS cost with the amount that each sector is expected to be able to pass-through to end consumers.
For each sector, we use external research to estimate the share of pass-through costs, which calculates pass-through rates by considering elements such as price-elasticity of demand. For electricity generation, estimate that 42% of ETS costs have historically been passed-through, while this share is on average 24% for aviation according to research (). Lastly, the European Commission itself estimates shares for pass-through of carbon prices for several sub-sectors of the materials and the fossil fuel sectors (. Based on these estimates, we eventually derive a 66% share of pass-through costs for Materials and 100% for Fossil fuels (see a summary of our assumptions on the left chart below).
Based on our calculations of how much of the carbon costs can be transferred to end consumers, we adjust the initial carbon cost estimates for each year by reducing them according to the percentage of costs that are expected to be passed through. Results are presented below.
Overall, from the charts above we can assess that:
The previously concluded limited impact of ETS prices into the EBITDA of the electricity sector becomes even more limited if we assume that utility companies are able to pass-through part of this cost to end-consumers.
As we assume a relatively limited ability of aviation companies to pass-through the higher ETS costs (due to, among others, the fact that aviation is considered a luxury good and the presence of substitute goods particularly for short-distance routes, such as road or rail transport), the aviation sector is still highly impacted by the roll-out of free allowances combined with higher ETS prices over the years.
In the shipping industry, if we assume a 100% pass-through rate, there is no impact of the ETS cost into a company’s profitability. However, a caveat to this assumption is that the extent of cost pass-through is in reality very uncertain. Sector experts suggest that the pass-through rate hinges on whether the cargo is present or absent from the vessel. Specifically, when a ship has no cargo, shipping companies are unable to transfer the additional expenses and must bear these costs independently. Conversely, when a ship carries cargo, the pass-through rate should be nearly 100%. Still, it seems fair to expect that the share of cost pass-through will be significantly high for the shipping sector, also given the absence of substitute goods.
Fossil fuel companies will handle the allowances from emissions of road transport, buildings and small industries. Therefore, it seems fair to assume that these sectors are the ones that will actually bear the ETS costs. In this case, we expect fossil fuel companies to be able to pass-through 100% of the costs to end consumers, implying no impact of ETS on these companies’ profits.
For Materials, as we previously elaborated, the ETS has only an impact if the sector does not receive 100% of free allowances. Were we to assume this not to be the case for illustrative purposes, the impact of ETS costs on companies’ profitability assuming a 66% pass-through rate would be even more limited than previously estimated. In this case, we forecast the ETS cost to fluctuate at around only 3% of EBITDA for the period between 2026 and 2030.
Conclusions
The ETS impact on companies from the electricity generation and materials sectors seems to be mostly manageable, particularly when considering the ability that these companies have to pass through some of these costs to end- consumers. Particularly regarding the materials sector, sub-sectors with high risk of carbon leakage are currently receiving 100% of free allowances, which makes them immune to rises in ETS prices. However, even in a scenario where these companies would stop receiving such free allowances, the impact of the ETS costs would still be quite limited on EBITDA. Carbon prices would have to see sharper increases in order to meaningfully disrupt the companies’ profitability, especially considering that they would be able to pass-through a large share of these costs.
For the aviation sector, transition risks - as proxied by the higher carbon prices - are expected to be significant due to its (i) growing trend in emissions, (ii) phasing out of free allowances by 2027 and (iii) higher ETS prices. As such, airlines are highly dependent on the development of sustainable aviation fuel (SAF) going forward. Interestingly, has shown that the marginal abatement cost for SAF is still so high that it is more cost-effective for airlines to internalize the carbon cost – despite the expected rise in carbon prices over the coming years. It is therefore safe to conclude that this is a sector that will be extremely harmed by the EU ETS scheme over the years, which makes it very vulnerable to transition shocks going forward.
Shipping companies will start using emission allowances this year, with coverage reaching 100% by 2027. Despite rising ETS costs, they will remain a small portion of EBITDA, lessening the impact on profitability. A caveat to this analysis is that we do not consider the IMO penalty price, which would further negatively weight into company’s profits. Maintaining a stable emission reduction path and consistent EBITDA growth will help mitigate transition risks associated with increasing carbon prices, although the former can be challenging given the high abatement cost of alternative fuels. With a potential full pass-through rate when cargo is present, the industry is well-insulated to cope with EU-ETS costs. Overall, the shipping sector is well-prepared to navigate the transition risks posed by ETS regulations.
With regards to fossil fuel companies, at a first glance one would expect them to be very vulnerable to the new trading system, and more broadly, to the transition due to their high carbon footprint. However, considering their ability to pass-through the costs to end consumers, we don’t see these costs actually affecting these companies’ profitability in the coming years. As such, also in this case, fossil fuel companies seem to be mostly immune to the ETS cost, with the biggest impact being felt by end-consumers (see our article on the expected impact of the EU-ETS2 on households energy bills here).
Furthermore, we note that our analysis is that we take into use Bloomberg NEF estimates for ETS prices, which to are expected to rise only slightly over the years. However, there is a risk that these prices are underestimated. For example, some climate models estimate that, as in a net zero scenario, carbon prices could rise to as high as EUR 470/ton in 2030 (vs. EUR 147/ton as per BloombergNEF estimates). The former would definitely have a very significant adverse impact into companies.
Overall, our analysis points to the fact that the impact of the ETS will be more macroeconomic, rather than isolated on specific industries and companies. This is due to the high ability of some sectors to pass-through the ETS costs to end consumers, resulting in higher prices for goods and services. Additionally, the availability of free allowances until after 2030 helps mitigate the immediate financial burden on businesses (this is particularly the case for the materials sector). Consequently, the ETS impact will be mostly widespread across the economy, implying that companies will be mostly impacted through second-round effects, which we did not take into account in this analysis. As such, sectors that are more exposed to the cycle, could be hit more significantly, even in the case that they are resilient to ETS cost rises. In a previous piece we discuss the macro-economic impacts of the transition )(here).