Global manufacturing - Riding the tariff rollercoaster

Global manufacturing PMI rose back to expansion territory in June … The global manufacturing PMI rose back to expansion territory in June (50.3), after having dipped below the neutral 50 mark separating expansion from contraction in April/May. The pattern was broad-based amongst developed economies (DMs) and emerging economies (EMs), with the average for DMs down in March and up again since May and the average for EMs down in April/May and up again in June.

Obviously, these dynamics seem to be impacted to a large extent by twists and turns in US tariff policy over the past few months. Following the introduction of specific tariffs for China, Canada and Mexico in February, broad (globally spread) reciprocal tariffs were initially announced in early April but partly reversed one week later, leaving a 10% universal tariff in place. This went hand in hand with a sharp escalation in US-China tariffs during April, until financial markets and US corporate lobbying forced the Geneva ‘US-China truce’ by mid-May that led to a (temporary) winddown. Next to these country-specific tariffs, the US introduced several product-specific ‘Section 232’ tariffs, for instance on steel/aluminium (50%) and cars (25%), which also affect global industry and trade (see our June Global Monthly for a brief overview of this tariff ‘rollercoaster’ episode).
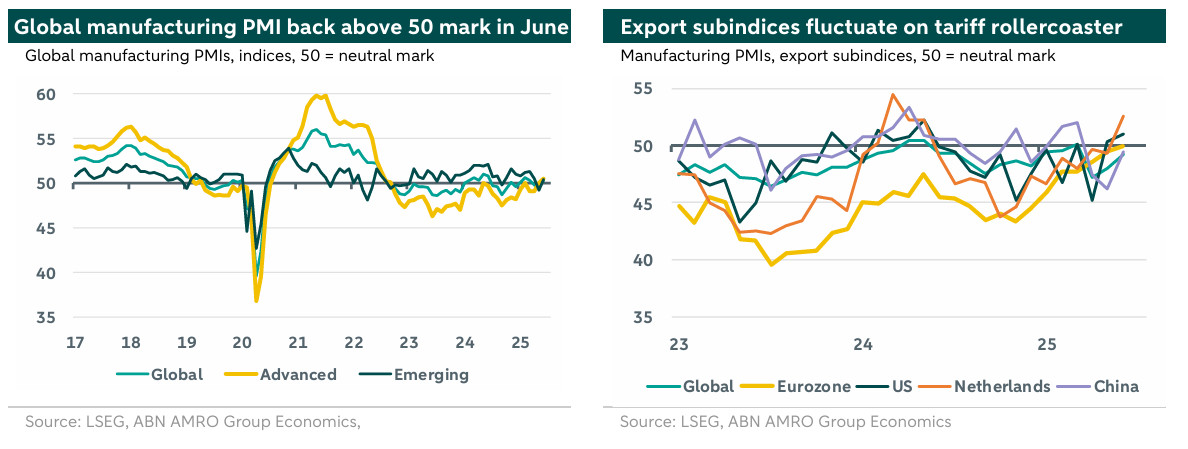
… with the tariff rollercoaster clearly impacting the export subindex
The impact of the tariff turmoil is probably most visible in the evolution of the global manufacturing PMI’s export subindex. This component dropped by almost three points in April (to 47.3), but recovered in subsequent months, particularly in June – rising back to a three-month high of 49.3, although remaining below the neutral mark. This pattern was broad-based amongst a wide number of developed and emerging economies, including for the US itself. Particularly striking is the development of Caixin’s
export subcomponent for China (China’s Caixin index, with a stronger focus on export-oriented firms, is included in the global PMI survey). This subindex fell by almost six points between March and May, but rose back by more than three points (49.4) in June following the US-China truce. Meanwhile, the export component for the eurozone was relatively solid in this period, climbing back to the neutral 50 mark in June. That was particularly true for the Netherlands, for which the export component rose to a 15-month high of 52.5 in June (also see here).
Trade frontloading and the unwinding thereof still in play, exact timing uncertain
We should note that survey data like the PMIs – including the export components – may be a bit more difficult to interpret during this period of tariff turbulence, given the potential impact of shifts in sentiment and the prevalence of practices such as trade frontloading in the run-up to (expected) higher tariffs. Looking at some recent hard trade data, US overall imports more or less stabilized in May, after a frontloading-driven spike in March and a subsequent correction in April (also see our June Global Monthly). Meanwhile, total US exports dropped by 4% m/m in May, following a 3.4% rise in April. While US imports from China have dropped further in May as expected, imports from the EU picked up slightly again (see chart). That may point to some further frontloading, now that the US-imposed ‘deadline’ (extended to 1 August) for trade deals is nearing and some new Section 232 tariffs (for instance for goods like pharmaceuticals) may be rolled out. All in all, while we still expect the unwinding of frontloading to lead to a Q2 reversal of the effects on eurozone GDP seen in Q1, there is high uncertainty around the timing, and these effects may come later than we have currently incorporated into our forecasts.
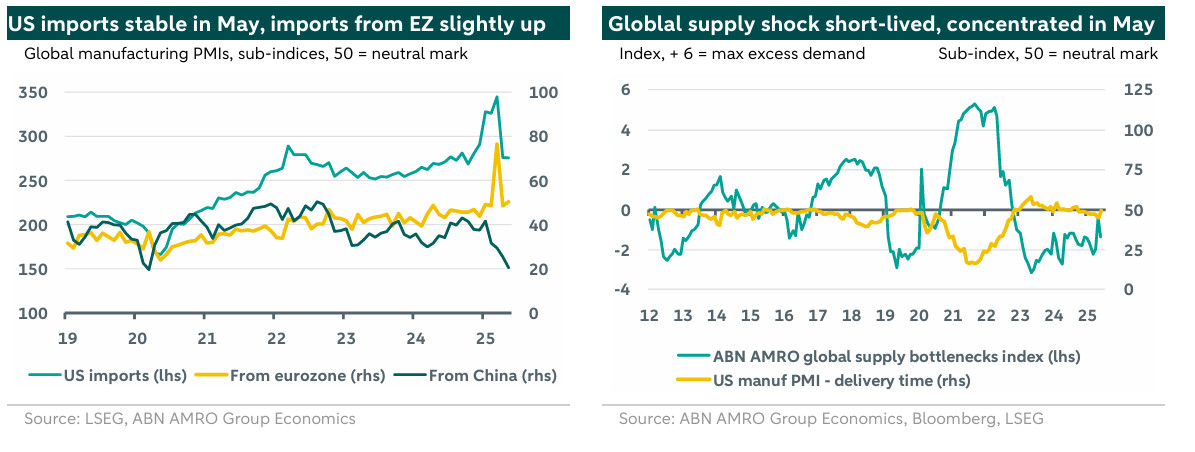
Global tariff-related supply shock short-lived, concentrated in May
The massive US-China tariff escalation in April/May led to imminent supply chain threats concentrated in the US, with China-US container flows coming down sharply (also see our China June Monthly). This was visible in a drop in the global manufacturing PMI’s subindex for delivery times (lower values mean longer delivery times). The DM average fell by 1.3 point in May to a 31-month low of 47.9 – still well above the values seen during the pandemic, when there were broad global supply disturbances. This decline was mainly driven by the US, where the delivery time subindex fell by 2.3 points to 45.2 in May. It seems that thanks to the Geneva truce - followed by a normalisation in China-US container flows – the increase in delivery times was quite short-lived: both the index for the US and the DM average rose back in June. All of this is also captured by our global supply bottlenecks index, with the spike in May driven by longer delivery times next to a (temporary) decline in the output EMs/orders DMs ratio.