Global trade and industry - Ongoing strength despite bottlenecks
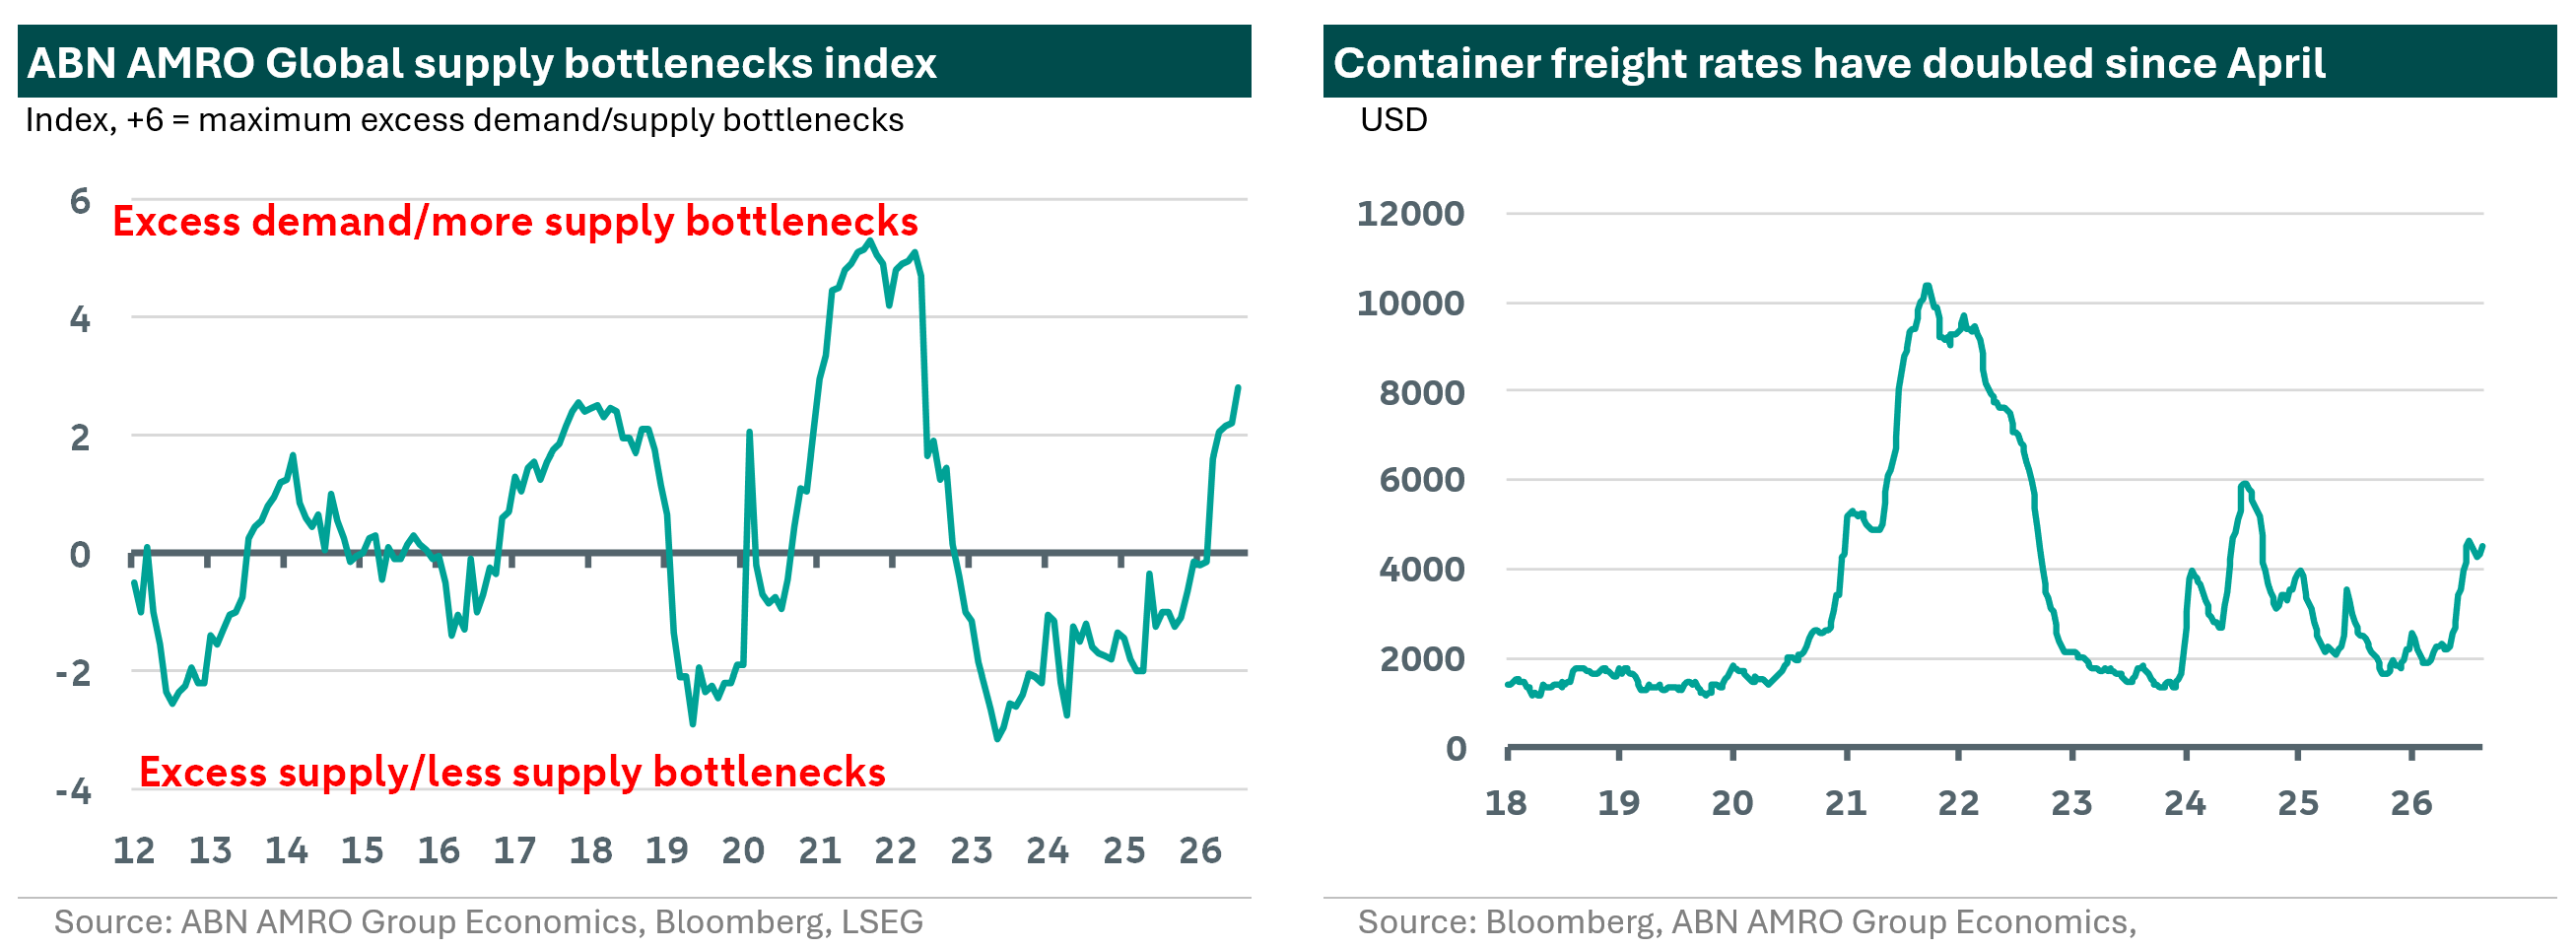
Global trade growth remarkably strong in first half of 2026… supported by the ongoing global AI boom/capex troika, resilient consumer spending, a fading tariff drag and trade rerouting, and stockpiling following the Iran conflict. Manufacturing PMIs also point to ongoing strength in global industry and trade. Our global supply bottlenecks index has risen to a post-pandemic high. Bottlenecks are adding to inflationary pressures.

Global trade growth remarkably strong in first half of 2026
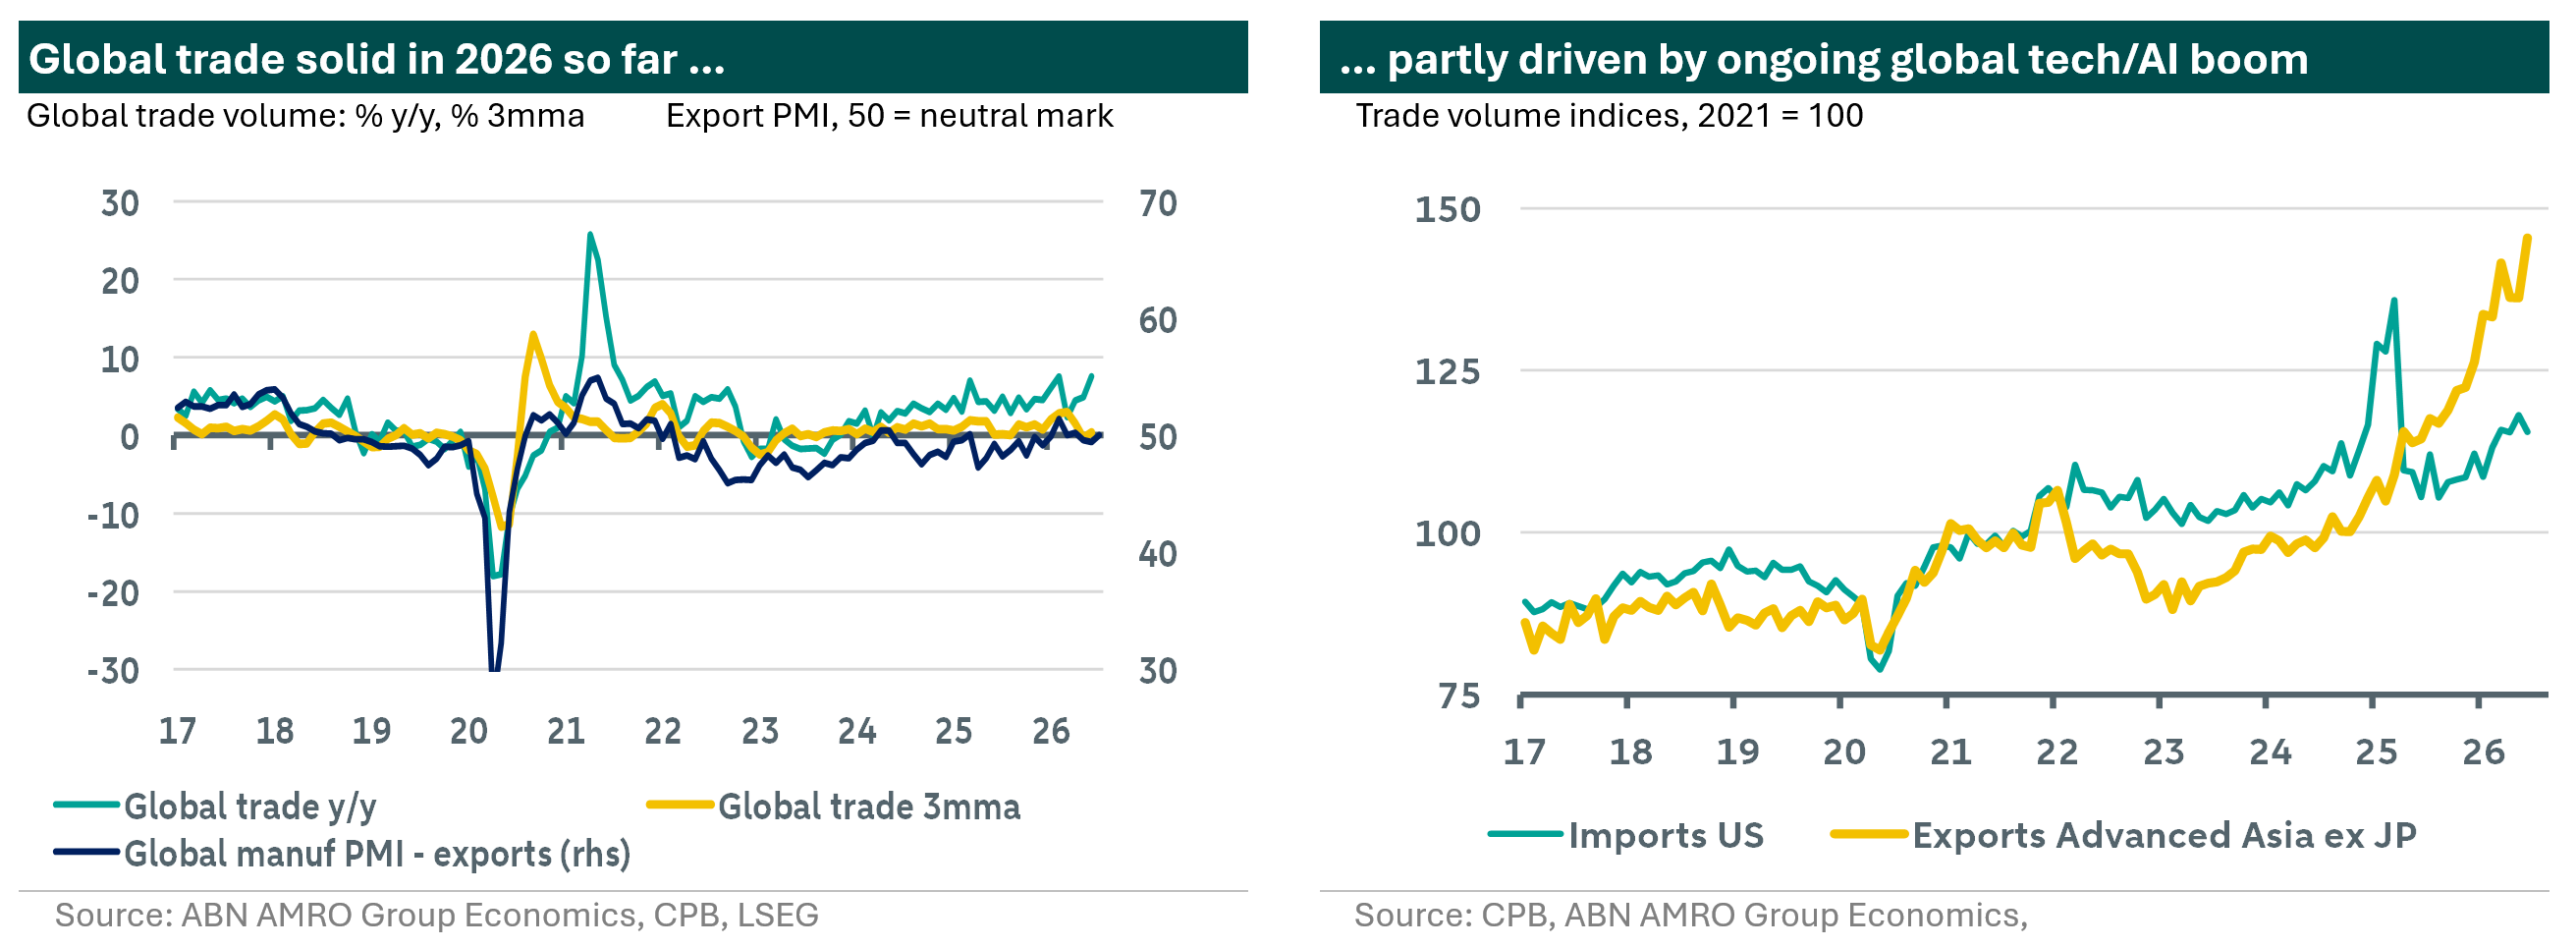
Global goods trade is showing a remarkable strength so far this year, shaking of the impact from the Iran conflict/ energy shock. After having grown by an above-trend annual rate of 4.2% in the ‘tariff year’ 2025 helped by special factors such as tariff frontloading, trade rerouting, and the AI boom, general expectation of leading institutions like IMF and WTO was that annual growth of global goods trade would naturally slow down this year. However, if we look at the development of CPB’s world trade volume index – June update published earlier today –, the opposite is true. Annual goods trade growth is reported at an average of 5.5% y/y in the first half of this year so far. After a brief downward correction in March (-2.6% m/m), just after the start of the Iran conflict end-February, the CPI index started rising again. In June, the index rose by 2.0% m/m, after more moderate increases in April and May. On a 3-month over 3-month rolling basis, world trade showed 0.4% growth again in June, after a small contraction in May. All in all, annual growth of global (goods) trade is therefore on its way to be even stronger this year compared to an already exceptional 2025, barring sharp negative shocks in the second half of this year. Meanwhile, the relationship between the global manufacturing PMI’s export subindex and global trade seem to have weakened over the past few years.
What is supporting global goods trade this year?
A couple of (special) factors seem to drive the resilience of global trade this year:
Resilient consumer spending: Notwithstanding the energy shock from the Iran conflict and the closure of the Strait of Hormuz, consumer spending shows resilience in key economies like the US and the eurozone (whereas in China consumption is still lagging). This partly reflects that the impact on energy prices so far has been muted by offsets like a shift in oil transport towards Gulf pipelines, a rise in energy exports from non-Gulf countries, and a fall in oil demand, particularly in China/Asia. The remaining gap has been picked up by inventories, which declined sharply in OECD countries for instance.
AI boom/capex troika: The global economy was already building momentum going into the conflict, with AI, (green) energy and defence feeding an capex investment troika (also see our Global Monthly, Teflon economy shaking off another shock). This is also feeding through into global trade, with for instance AI-related trade showing ongoing strength. Regional trade volume data from CPB, for instance, show a sharp increase in Advanced Asian export volumes in 2025 and 2026, coupled with a recovery of US import volumes in 2026 year following the post-frontloading correction seen in the second half of 2025.
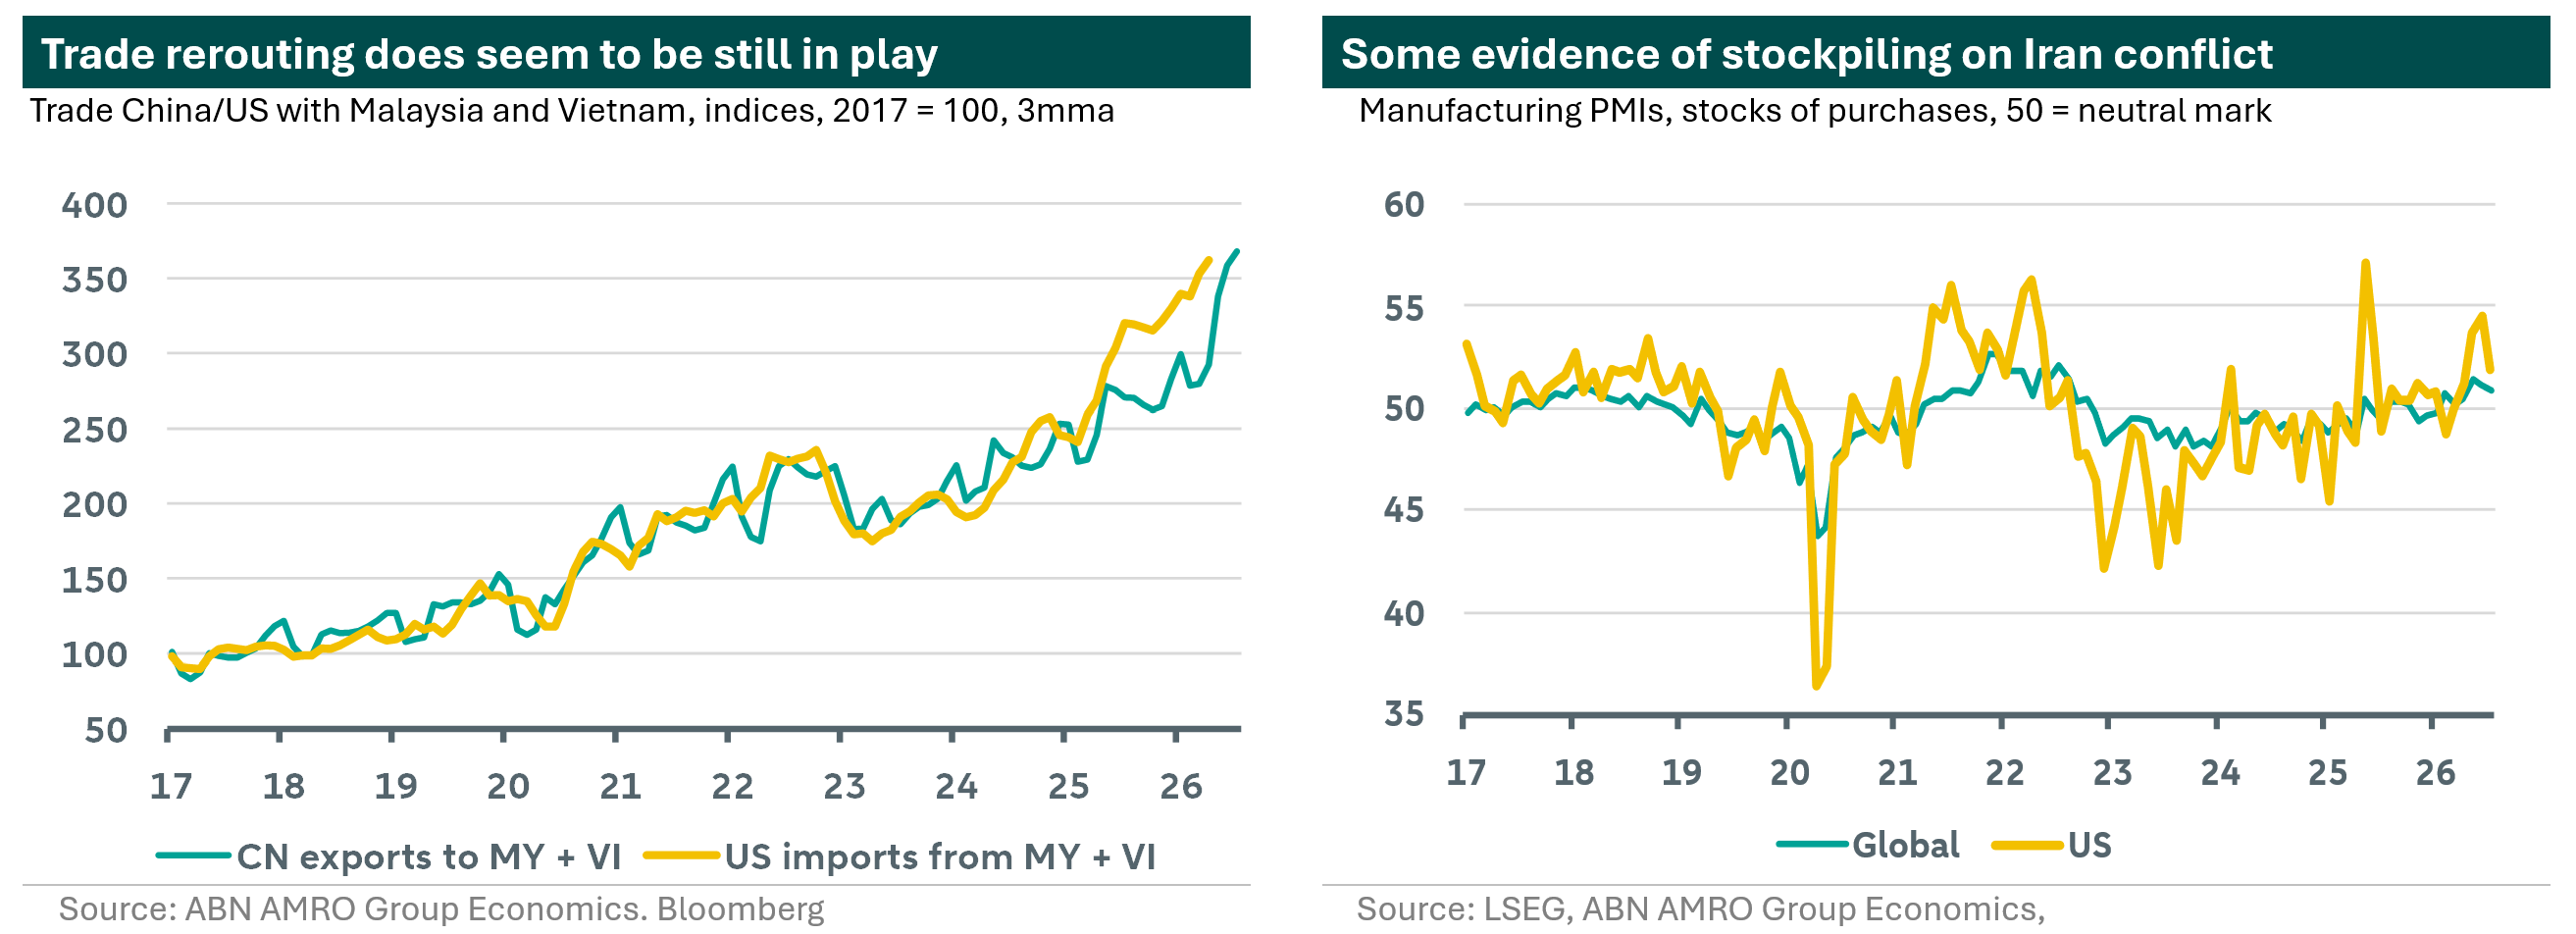
Fading tariff drag, trade rerouting continues: As US tariffs have generally come down since ‘Liberation Day’ due to various factors, the related drag to global growth and trade is fading. What is more, the practice of trade rerouting (possibly to evade tariffs) seems to be still ongoing. Chinese exports to Malaysia and Vietnam, for instance, continue to surge, and the same is true for US imports from these countries (see left-hand chart below). We should add that these restructurings in global supply chains were already in motion before the escalation of US tariffs last year, but tariffs seem to have accelerated this. Given that trade rerouting itself pumps up registered trade volumes as trade gets ‘triangular’, tariffs may in fact even affect global trade volumes positively in the current juncture.
Stockpiling following the Iran conflict: Apparently, the escalation of the Iran conflict that started end-February has also led to some frontloading of purchases by importers, eager to secure their inputs in the wake of rising global supply chain risks and prices. This is visible in the rise of the stocks-of-purchases component of the global manufacturing PMI, particularly for the US (see right-hand chart below).
Manufacturing PMIs also point to ongoing strength in global industry
Whereas the CPB data are lagging a few months, the resilience in global trade and industry is also visible in the more forward-looking global manufacturing PMI, which rose to a four-year high of 52.7 in May, before falling back somewhat in June and July. The strength is concentrated in advanced economies, for which the average index was 53.4 in July. The flash PMIs for August for several advanced economies published so far point to a picture of ongoing strength. Remarkably, the eurozone (flash) manufacturing PMI rose to a four-year high of 52.8 in August, although this reading is flattered to some extent by still lengthy delivery times (51.8 after correction for delivery times). The manufacturing PMI for Germany jumped by almost two full points to 54.1, also the highest reading since May 2022. Japan’s manufacturing PMI also moved higher in August. The manufacturing PMIs for the US (that of S&P Global, not ISM) and the UK lost some ground in August, but remained well in expansion territory. Meanwhile, the average for emerging economies dropped back to a four-month low of 51.0 in July, with China’s manufacturing PMI from RatingDog (included in the EM average) having dropped by 0.8 points to 50.9. China does not publish flash PMIs; its August manufacturing PMIs will be published on 31 August (NBS) and 1 September (RatingDog).
Bottlenecks are rising on balance, adding to inflationary pressures
In previous publications, we have pointed at the building up of supply bottlenecks related to the Iran conflict and the ongoing global AI boom, and the inflationary impact thereof (see for instance, Global trade and industry quite resilient, partly helped by AI-boom and our July Global Monthly (link above). Our global supply bottlenecks index rose to a post-pandemic high in July. That is driven by several ingredients. First, the delivery times components included in our index are still pointing to delivery times in global supply chains that are longer than usual (particularly in advanced economies). Second, container freight rates are rising again, with benchmark rates more ore less doubling since April (see chart), although remaining well below the pandemic peak – and even below the 2024 peak. This rise in container tariffs likely reflects bottlenecks in global shipping (such as disturbances in the Strait of Hormuz and the wider Gulf region, low water levels impacting Panama Canal) combined with ongoing strength in global (shipping) demand. Third, our indicator measuring global supply-demand conditions has shifted more in the direction of excess demand recently. The rise in global supply bottlenecks is also going hand-in-hand with stronger price pressures from global industry. The global manufacturing PMI’s subindices for input and output prices rose to post-pandemic highs in the first months of the Iran conflict, although they have dropped back somewhat in June and July.