The housing market in the grip of higher interest rates

We expect house prices to rise by 3% in 2026 and 4% in 2027. The price increase is slowing due to higher mortgage rates. Income growth and limited housing supply are supporting price growth. The number of transactions is falling by 3% in 2026 and 4% in 2027. This is because investors are selling fewer rental properties.

Mike Langen
Senior Economist Housing Market

After a strong start to the year, the housing market is cooling off.
Following years of strong price increases, we expect house price growth to slow in 2026. Figure 1 shows the month-on-month growth in prices. The yellow trend line, which is seasonally adjusted, shows that monthly price growth has been slowing since last year. Based on this trend, we expect the house price index (hpi) to rise by 3% this year. The underlying causes are declining housing demand and higher mortgage rates. However, we do see differences between regions. In rural areas, prices are still rising while price growth in cities is levelling off. Former rental properties coming onto the market due to the ongoing wave of sales by investors (“uitponden”) remain in demand because they are relatively affordable. For next year, we anticipate a slight acceleration in price growth to 4%, partly due to the ongoing housing shortage.
High price levels and rising mortgage rates are dampening demand.
The main reason for the cooling of the housing market is declining demand. Affordability has decreased due to the sharp price increases of recent years. Many buyers, especially first-time buyers, must dig deep into their pockets. For several years now, median buyers take out mortgages of 90% to 95% of the maximum possible. This maximum is determined by Dutch lending standards (NIBUD) and is calculated based on income and financial obligations. Since so many households already borrow nearly the maximum amount they are allowed to, there is limited room to stimulate demand by borrowing even more. Instead, increasing demand is dependent on higher wages (income) and the potential use of equity (e.g. savings, overvalue). For 2026 and 2027, we expect wage growth to slow down as the labour market becomes less tight and economic uncertainty is increased. This uncertainty is also weighing heavily on consumer confidence and the willingness to use savings. Although the most recent figures from Statistics Netherlands (CBS) show a slight uptick compared to May, the sub-index for major purchases (e.g. a house) remains at its lowest level in two years. Overall, this suggests weaker demand for housing, which is roughly growing with income growth.
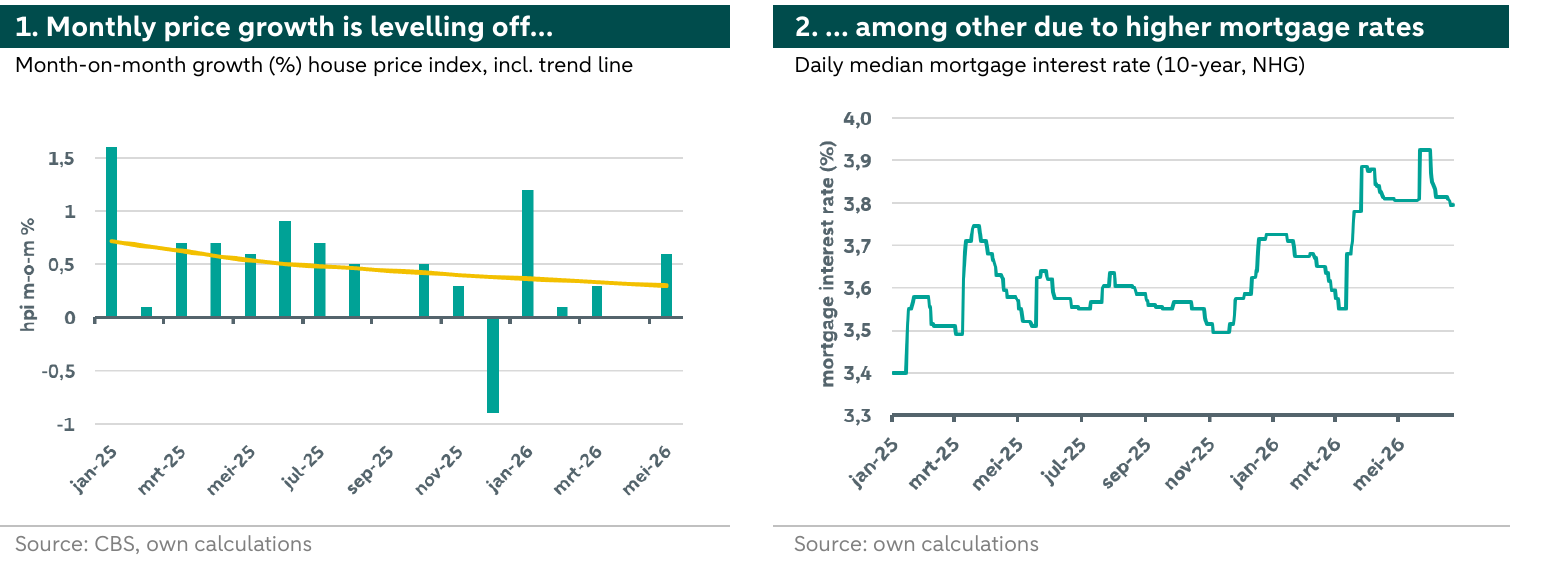
Higher interest rates are further dampening demand for housing.
Mortgage interest rates are also a determining factor in the NIBUD lending standards. Higher mortgage rates reduce borrowing capacity. Figure 2 shows the daily median mortgage rate quoted in the market, showing an upward trend since early 2025. Although the changes appear small, they create additional headwinds for buyers. The ECB recently raised the deposit rate by 25 basis points due to higher inflation in the eurozone. We expect the ECB to raise interest rates further this year, which will likely push mortgage rates even higher. This will further reduce buyers’ borrowing capacity and thus dampen demand for housing.
Price-to-income ratios provide insight into relative affordability.
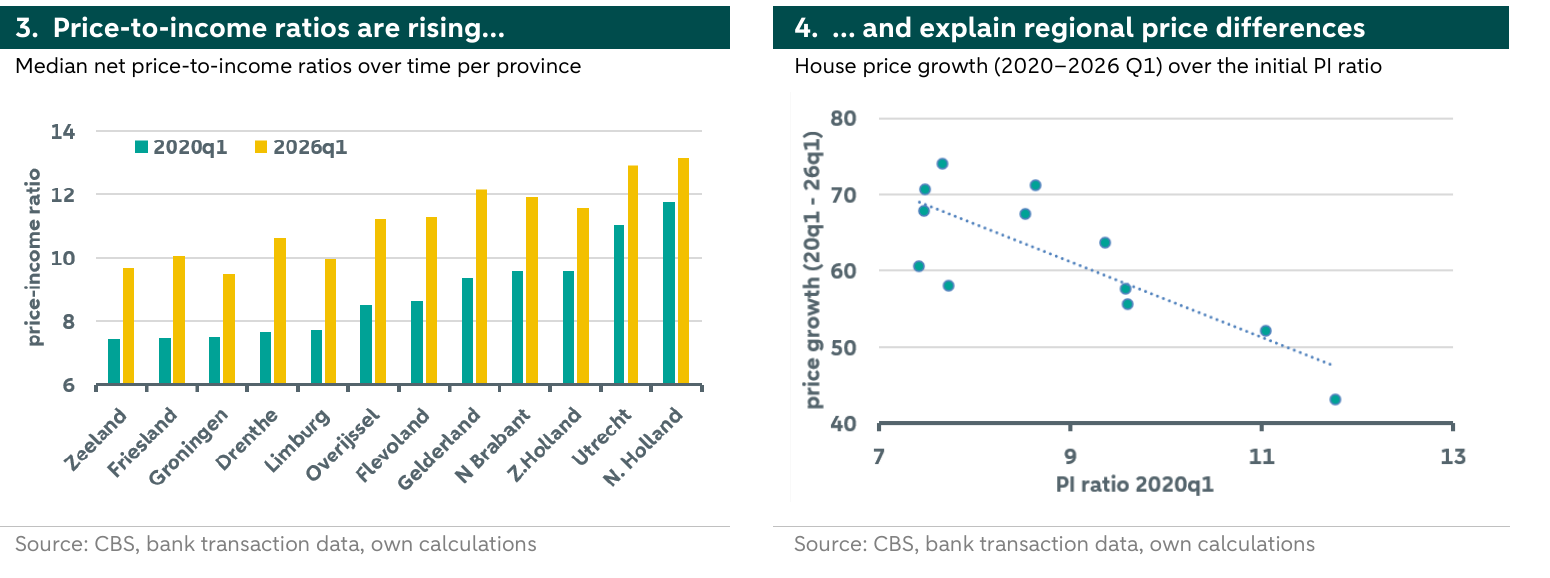
Our price estimate represents a national average. However, there are significant regional differences. Compared with the Randstad, rural provinces have shown higher price growth in recent years. One explanation for this is the so-called catch-up effect, whereby areas that have lagged behind in terms of price increases experience higher price growth and close the gap. To illustrate this, we estimate quarterly price-to-income (PI) ratios per province, using average regional transaction prices and median net household incomes between 2020 and 2026. The data on prices come from Statistics Netherlands (CBS), while the income data are derived from aggregated and anonymized bank transaction data (see the info box below for more details). Our net PI ratios indicate how many years of net annual household income an average home cost. For example, a ratio of 10 means that purchasing an average home requires 10 years’ worth of net household income.[1] Figure 3 shows the PI ratios by province in the first quarters of 2020 and 2026. We see regional differences, which is normal given variations in amenities, employment, etc. The Randstad is relatively the most expensive, but the gap with other regions is decreasing. In Figure 4, we show the relationship between PI ratios in the first quarter of 2020 and price growth over the following six years. A clear trend is visible: more affordable areas experience stronger price growth than more expensive areas.
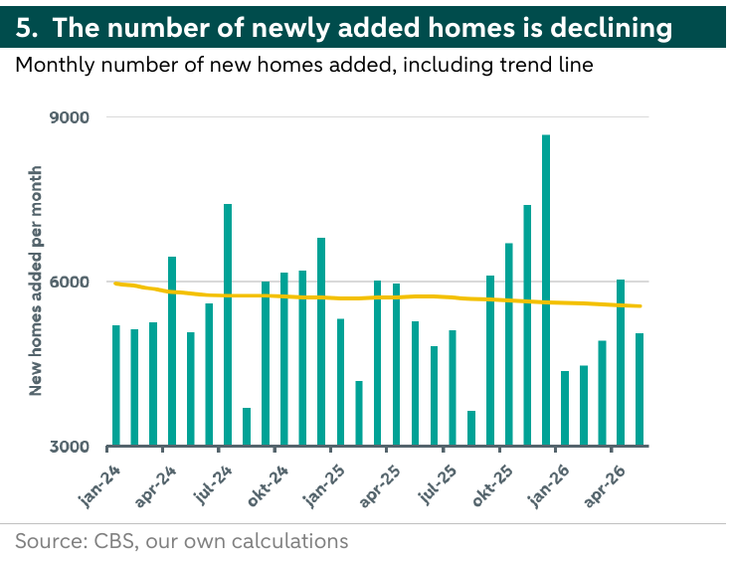
Housing supply remains a bottleneck.
The housing shortage is high on the current government’s agenda. However, the list of problems is long. In some regions, grid congestion is hindering efforts to make the existing housing stock more sustainable and to connect new homes to the . Due to labour shortages and rising material prices, developers are forced to prioritize between projects. Investors, and investors in particular, are staying away or considering to sell their investments due to better opportunities elsewhere, putting the long-term housing supply under pressure. On a positive note, the number of building permits issued is increasing. In the first five months of this year, 27.6% more building permits were issued compared to the same period in 2025. However, due to practical problems, the number of completed homes is declining. In the first five months of this year, 7.2% fewer new homes were added than in the same period in 2025. Figure 5 shows the number of newly added homes per month and the seasonally adjusted trend. The trend shows a downward trajectory, keeping the housing market tight.
Declining demand and lower sales of investment properties are driving down the number of transactions. We expect the number of transactions to fall, due to several reasons. First, there were many transactions early this year because buyers brought forward their purchase decision in order to avoid higher interest rates. In the months following, the numbers dropped again and month-over-month growth slowed. Second, the temporary surge in sales of investment (rental) properties (“uitponden”) by private investors is gradually coming to an end. Over the past two years, private investors have been selling rental properties due to tax changes and better investment opportunities elsewhere. In response to the reduced interest in rental properties, the current government intends to revise rent control policies and attract foreign investors, but it remains unclear which policies will be implemented and what impact they will have on investments in rental properties. Third, the number of housing transactions is constrained by the declining supply of homes, which is holding up moving chains. We therefore expect the number of transactions to decline by 3% in 2026 and by 4% in 2027, in line with our previous estimates.