Top of Mind - AI and the neutral rate: Live and let rise

Where policy rates settle in the long run, and where long-term yields trade, depends on the real neutral rate of interest, r*. AI is now putting upward pressure on it from two sides. The build-out of data centres, chips and power is the largest investment boom in decades, and the productivity gains it promises could change how fast the economy grows. This note asks what both do to r*, in the US and the euro area.


Our answer distinguishes between two phases. During the build-out, r* rises because firms want to invest more than the economy wants to save, whatever the eventual payoff. Once productivity gains arrive, who receives them determines how much higher r* stays; narrowly distributed gains increase saving, offsetting the upward pressure on r*. During both phases, other capex, ageing and climate shift the same balance of saving and investment.
The build-out lifts r* while it lasts: AI investment of around 3% of GDP a year adds about 0.2 pp to the US neutral rate over 2026–30, but not beyond
So far AI shows up only in short rates: AI capex news lifts the 2-year yield but leaves the term premium and the 5y5y real forward rate, the market proxy for long-run r*, unchanged
Productivity lifts r* only if the gains are shared: a broad boom takes US r* to about 2% by the mid-2030s, while concentrated or smaller gains leave it at 1.2–1.6%.
Euro area r* gets little of the lift: it rises to only about 0.1% during the build-out and settles at 0.3–0.6% by the mid-2030s; only broad adoption of AI takes it to about 1%.
A bust is the main downside: it is not our near-term base case, but it would take US r* back to around 0.9% at the trough.
Where policy rates settle in the long run, and where long-term yields trade, depends on the real neutral rate of interest, r*. AI is now putting upward pressure on it from two sides. The build-out of data centres, chips and power is the largest investment boom in decades, and the productivity gains it promises could change how fast the economy grows. This note asks what both do to r*, in the US and the euro area.
Our answer distinguishes between two phases. During the build-out, r* rises because firms want to invest more than the economy wants to save, whatever the eventual payoff. Once productivity gains arrive, who receives them determines how much higher r* stays; narrowly distributed gains increase saving, offsetting the upward pressure on r*. During both phases, other capex, ageing and climate shift the same balance of saving and investment.
How AI moves r*: two curves, two phases
The neutral rate is the real interest rate that balances desired saving and desired investment at full employment. Throughout, r* means this real rate. We look at two horizons: the next five years, over which a temporary surge in investment can lift the neutral rate while it lasts, and the period beyond, when only lasting changes in growth, saving or investment matter. With inflation expectations anchored at 2%, the nominal neutral rate is r* plus 2%. Cheaper production from AI lowers inflation for a while but not r*, and we treat the term premium separately. We summarise the intuition behind our results below.
Build-out: investment up, saving unchanged, r* up
For the next few years, firms spend heavily on chips, data centres, power and the grid, increasingly with borrowed money, while the extra output this capacity will produce is still years away. Demand for saving rises with no extra saving to meet it, so r* rises. During this time, we estimate upward pressure of about 0.2 pp on the neutral rate in the US.
Productivity with broadly shared gains: investment up, saving unchanged, r* up
A higher return on capital makes more projects pay, so investment rises again. The extra income goes mostly to households that spend it, so saving does not rise to match, and r* rises by a cumulative 1 pp.
Productivity with concentrated gains: investment up by less, saving up, r* ambiguous
Dominant firms invest less per unit of profit, so investment rises by less. Saving rises because income flows to high-saving households and firms, and workers at risk of displacement put more aside. With the two curves moving in opposite directions, the net effect on r* can go either way. The 2010s, with record tech profits and a very low r*, show how strong the saving side can be. In such a scenario, we estimate upward pressure of about 0.2 pp relative to a no-AI scenario.
These numbers come from a deliberately simple model in which the change in r* comes from extra productivity growth or changes in desired investment and desired saving, expressed as shares of GDP. They are measured against a world without AI.
Phase 1: the build-out
The build-out works through two channels that show up in different parts of the yield curve. The demand channel, the spending itself, lifts growth and prices, and with them the policy rates the Fed needs over the next few years. The bond-supply channel, the borrowing that pays for it, should raise the term premium. We give the term premium extra space because it is the main way long yields can rise without r* rising, so the market evidence can only be read once the two are kept apart. Neither channel changes r* beyond the build-out; that takes Phase 2.
The demand channel
According to consensus equity analyst forecasts, AI investment averages around 3% of GDP a year over 2025–2030, roughly three times the ICT investment of past booms. Capex growth is set to slow from more than 70% to around 40% in 2027, but the level keeps rising. In the third quarter, investment in information processing equipment and software added 1.1 pp to GDP growth of 3.4%, and over the past four quarters it has accounted for close to half of US growth, although there are some import offsets.
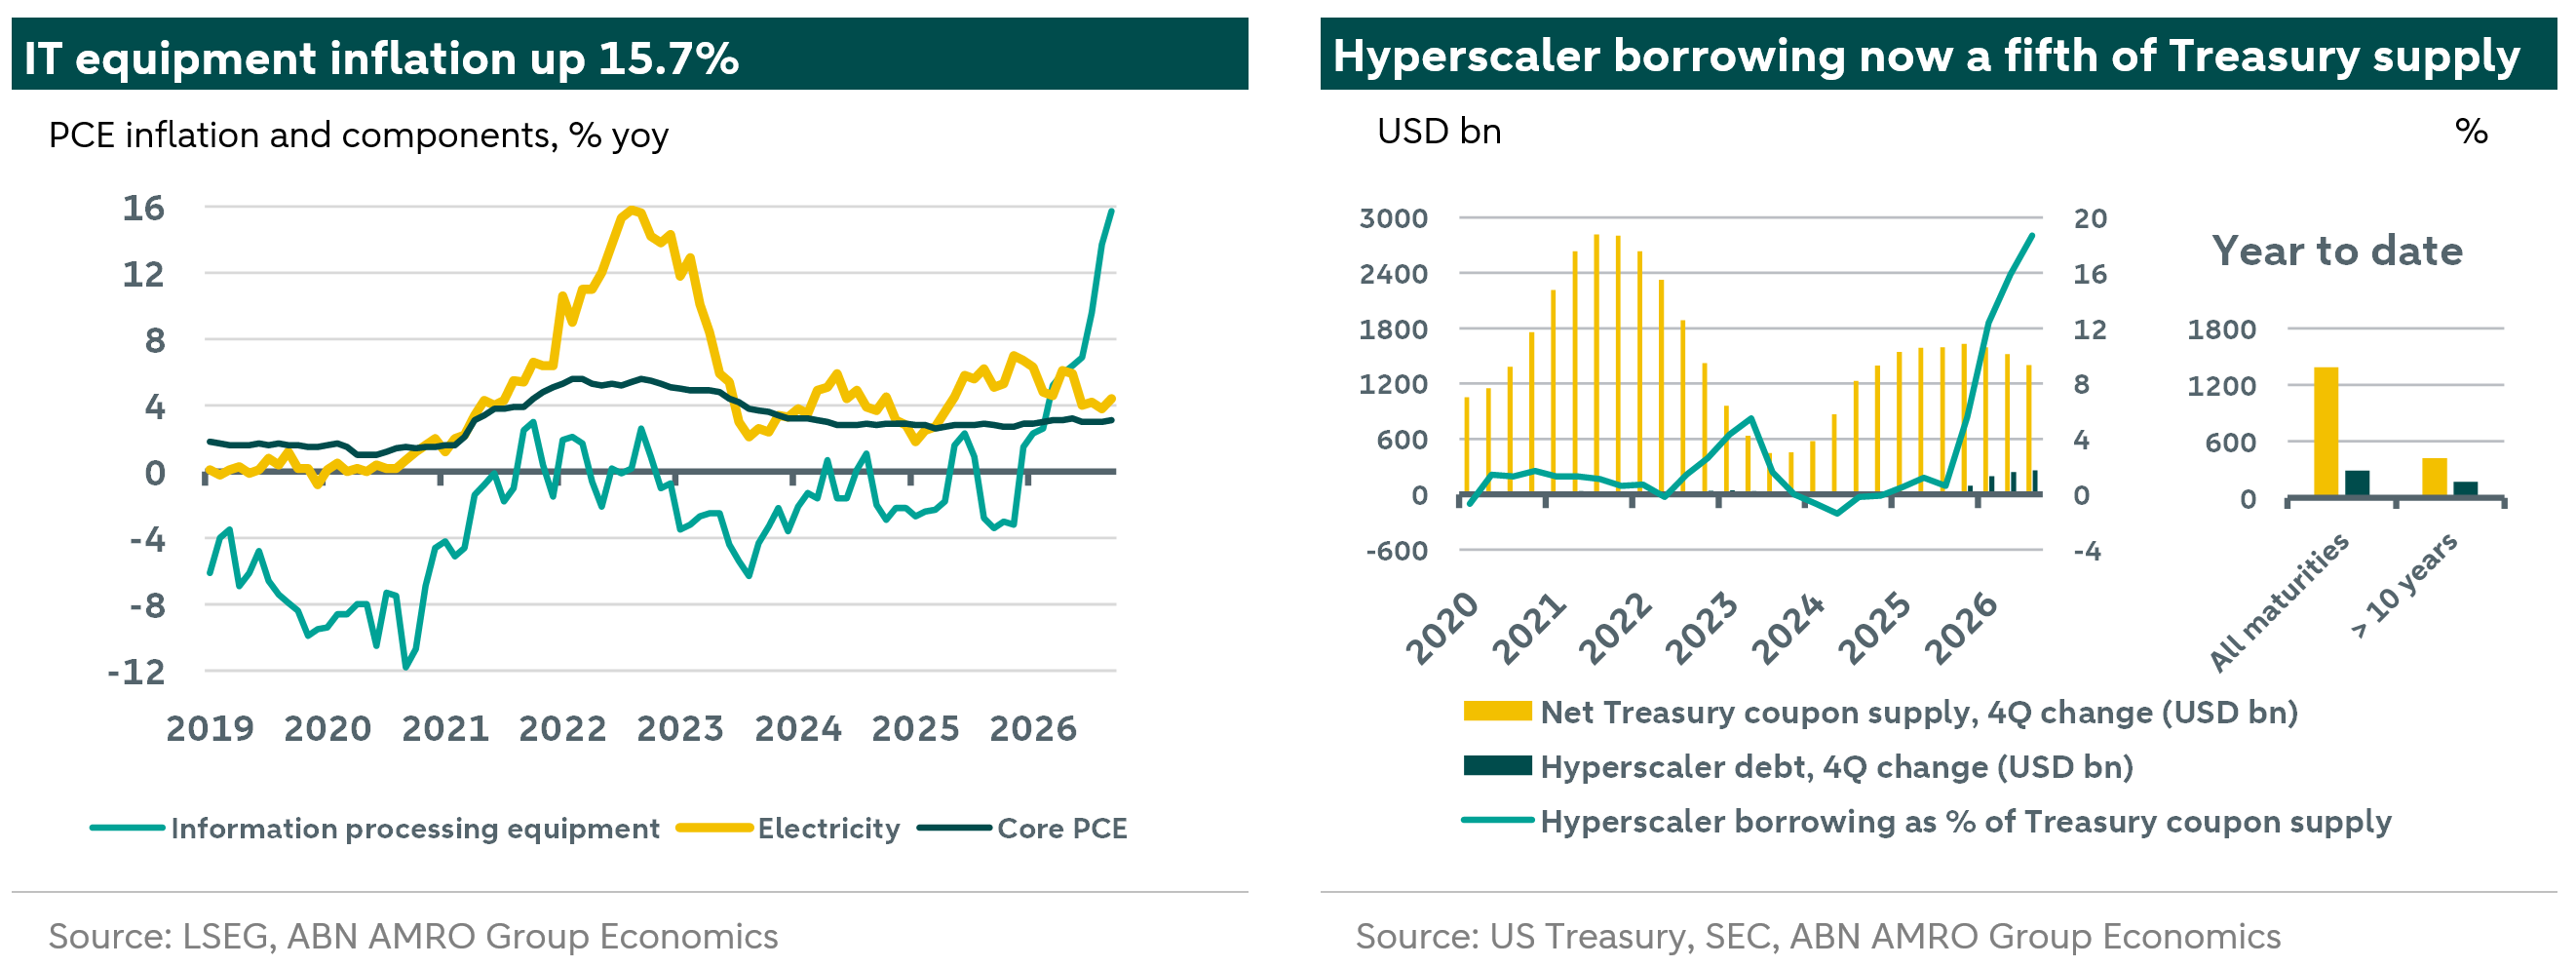
The demand arrives years before the extra supply, and it is already showing up in prices. Prices of information processing equipment fell by 5–10% a year in 2019–20 and were still falling in late 2025, but have since turned up sharply, to 15.7% in September, as data centres absorb memory and components. Producer prices of switchgear and power transformers are up about 90% since 2019, against 26% for the same component in core consumer prices. This inflation argues for higher policy rates over the next year or two, not for a higher r*. Higher growth and inflation mean that the policy rate needs to be restrictive and hence held above r* for a time.
The bond-supply channel
The build-out is turning AI firms from holders of cash into issuers of long-dated debt. Capex at the five largest hyperscalers absorbed 70% of their operating cash flow in 2025, up from about 40% in 2018–2020, and their combined debt roughly doubled to USD 503bn in the year to September 2026. What matters for the term premium is how this compares with the supply investors already absorb, which is dominated by Treasuries. In the year to September 2026, the hyperscalers added USD 261bn of debt, against USD 1.4 trillion of net new Treasury notes, bonds, TIPS and floating-rate notes held by the public. That is about a fifth, up from almost nothing a year earlier. At the long end the share doubles. Of the USD 288bn of bonds the hyperscalers issued, 59% runs for ten years or more. Treasury supply beyond ten years grew by only USD 420bn, and beyond 15 years it shrank, as bonds issued in 2011 and 2020–21 rolled below that horizon. Beyond ten years, the hyperscalers added 40% as much debt as the Treasury, and beyond 15 years they were the only source of new supply.
The build-out lifts r* while it lasts
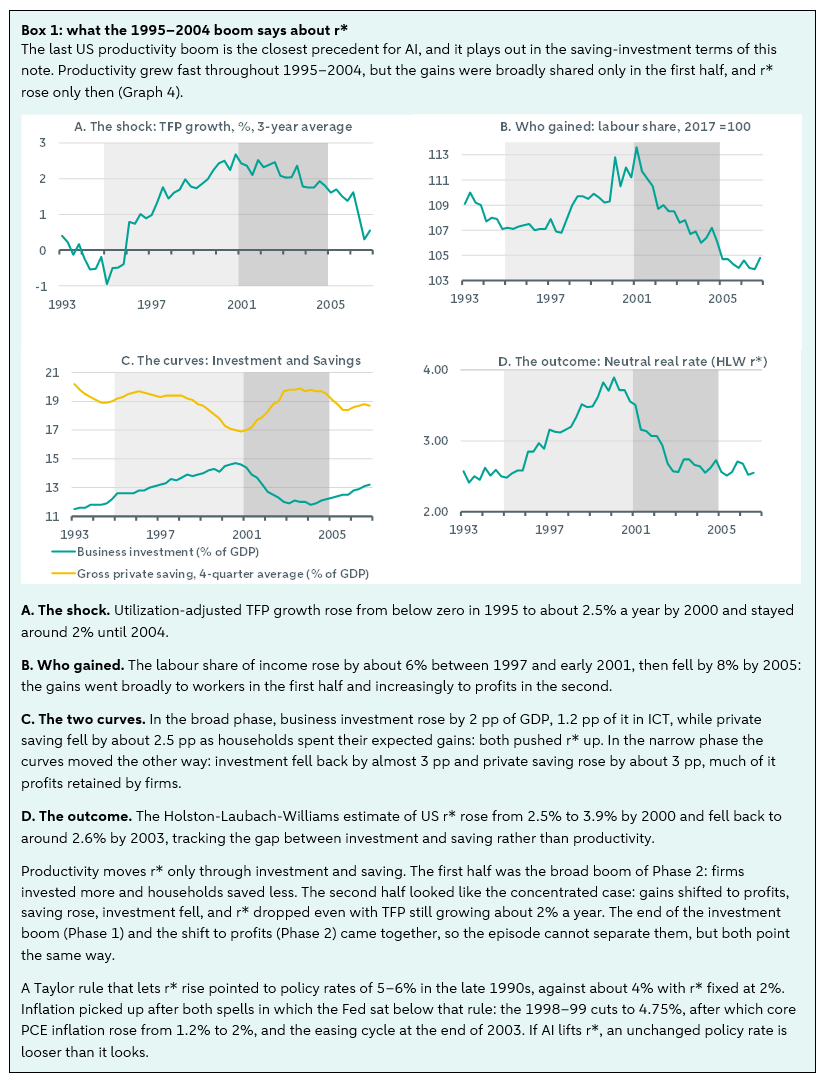
Extra investment demand raises r* only while it lasts, and the build-out runs over roughly 2026–30, so its effect falls mostly within the horizon that short rates cover and should not move rates expected beyond it. The ICT boom followed the same pattern (Box 1). A higher neutral rate during the build-out and a stronger cycle both point to higher policy rates for a few years; neither implies a higher long-run r*.
We estimate a boost to desired investment of 1–2% of GDP a year, net of imported hardware, against roughly 1% before the boom. Because the push is temporary, we size it by the stock of extra AI capital that savers have to finance: with servers and chips wearing out after about five years, it builds to about 4–7% of GDP by 2030 and fades over the early 2030s. That holds even though most of it is paid for from the hyperscalers’ own cash flow, which would otherwise have gone back to shareholders. Applying CBO’s (2019) estimate that each percentage point of GDP of extra claims raises interest rates by 2–3 bp gives a lift to the US neutral rate of about 0.2 pp.
Distinguishing a neutral-rate effect from a cyclical one
Both mean higher policy rates today, but they diverge over the next few years. If the build-out lifts the neutral rate, policy rates should stay high after the boost to inflation from IT equipment fades next year, and model estimates of r* should drift up before easing as investment growth slows. If the effect is cyclical, policy rates fall back with inflation. If AI firms keep borrowing at this pace, the term premium should also start to rise. Real rates over the long term should not rise because of the capex boom in either case; beyond five years, r* depends on Phase 2.
Markets price a temporary bump in the neutral rate
Markets show which effects of the AI build-out are already visible in expected policy rates, in the term premium, or in the long-run real rate. We use two sets of news days to separate them.
AI capex news days. To isolate news about the scale of the build-out, we use 21 days of news about how much will be spent on AI compute, mostly Nvidia earnings releases, whose revenue largely reflects hyperscaler capex, plus landmark moments such as Stargate and DeepSeek. Because capex now runs ahead of hyperscalers’ cash flow, the same news also signals how much AI firms may need to borrow, so these days speak to both the demand and bond-supply channels.
AI bond deal days. To isolate the bond-supply channel more directly, we also look at the ten largest hyperscaler bond deals since September 2025. If the growing supply of AI-related debt is large enough to change the price of duration, these are the days on which it should be most visible in long yields and the term premium.
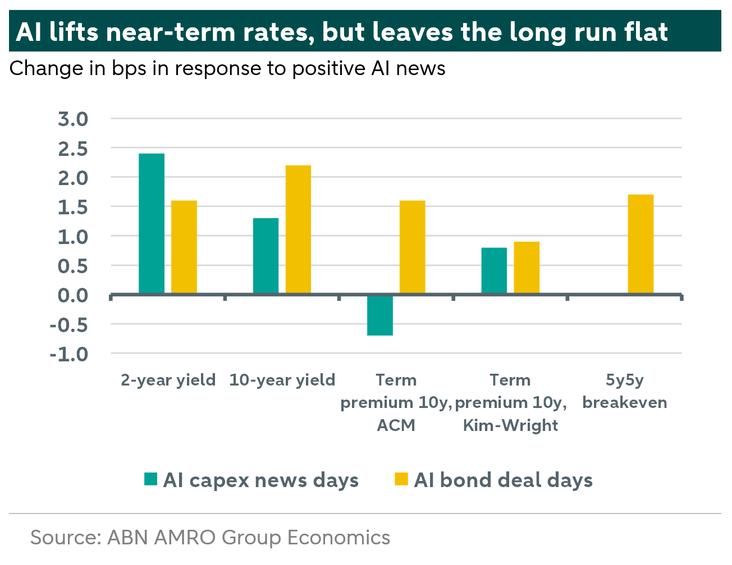
We split the market response between the 2-year yield, capturing policy rates over the next two years; the term premium; and the 5y5y real forward rate, the usual market proxy for long-run r*.
The results show a clear divide. AI capex news moves the short end. On the average AI capex news day, the 2-year yield moves 2.4 bp in the direction of the news and the 10-year 1.3 bp. But the 5y5y real forward rate does not move on average.
AI bond issuance reaches the long end, but only weakly. On the days of the ten largest hyperscaler bond deals, the 10-year yield rose by about 2 bp and the term premium by 1–1.5 bp, but the 2-year rose almost as much. That points to dealers hedging new issues rather than a lasting repricing of duration.
So far, AI shows up only in short rates, which is consistent with the higher neutral rate during the build-out we suggested above. AI capex news lifts the 2-year yield, but barely moves the term premium or long-run real rates. Even large AI bond deals leave no lasting mark. Markets therefore treat the build-out mainly as a reason for policy rates to stay higher for a few years, not yet as evidence of a lasting rise in r*.
Phase 2: productivity gains
If AI raises trend productivity, the return on capital rises and so does r*. The 1995–2004 boom shows that the effect is real but not automatic (Box 1): how much of the extra growth reaches r* depends on what households do with the extra income and on who receives it.
We start with estimates of the potential productivity gain. Estimates of AI’s boost to US labour productivity growth over the next decade range from about 0.1 pp a year (Acemoglu, 2024) to 1.5 pp (Goldman Sachs, 2023). We use the OECD’s US range: 0.4 pp a year in the low-productivity scenarios and 0.9 pp in the high ones. These are decade averages, so we allow almost no gain during the build-out and apply the average by the mid-2030s; with an S-shaped adoption curve, the boost by then could be higher.
If the gains are broad, households that expect to be richer save less now, so rates have to rise to keep saving and investment in balance. In textbook models, r* rises one for one with trend growth, but in the data the link is much weaker (Hamilton et al., 2016), so we slightly reduce the pass-through. Faster growth also requires a larger capital stock. In a broad boom, that adds 0.5–1% of GDP to desired investment, which lifts r* further.
When gains are concentrated, the extra income goes mostly to high savers, so we cut the pass-through further. Saving also rises: we assume the labour share falls by 2–5 pp and that income shifted to capital owners is saved at a 20–30 pp higher rate (Mian, Straub and Sufi, 2021), plus precautionary saving by workers at risk of displacement. That adds 0.5–2% of GDP to desired saving. At the same time, market power roughly diminishes the extra investment.
One channel pushes the other way. Cheaper capital goods mean the same real investment needs less saving, one of the standard explanations for the fall in r* over past decades (Rachel and Smith, 2015), and AI makes computing power cheaper. While chip and grid-equipment prices are rising the effect is muted, but once compute prices resume their fall it could offset part of the capital-deepening push.
The productivity boost raises r* only if the gains are shared
With large and broadly shared gains (0.9 pp a year), AI adds about 0.8 pp to US r* by the mid-2030s. If the same gains are concentrated, extra saving offsets almost all of that: the central estimate is close to zero. With smaller gains (0.4 pp a year), AI adds about 0.3 pp if they are shared and nothing if they are concentrated.
A correction would reverse the build-out’s lift
Firms would cut capex sharply, as with IT investment in 2001–02, and investment would stay below its no-AI path until existing capacity is put to use, while falling equity prices and debt repayment would raise saving. We model it as capex falling 1–2% of GDP below plan for two to three years. That removes the lift of about 0.2 pp and takes US r* back to roughly its no-AI level, about 0.9% at the central trough and about 0% in the euro area; only a large rise in saving, or the upper-bound sensitivity, takes it as low as 0.5%. Central banks would follow r* down, the Fed faster than the ECB, and as AI firms stop issuing, pressure on the term premium eases. Once the excess capacity is used, r* moves back towards whichever productivity path AI ends up on.
Europe: little of the build-out’s lift, but a share of the productivity gains
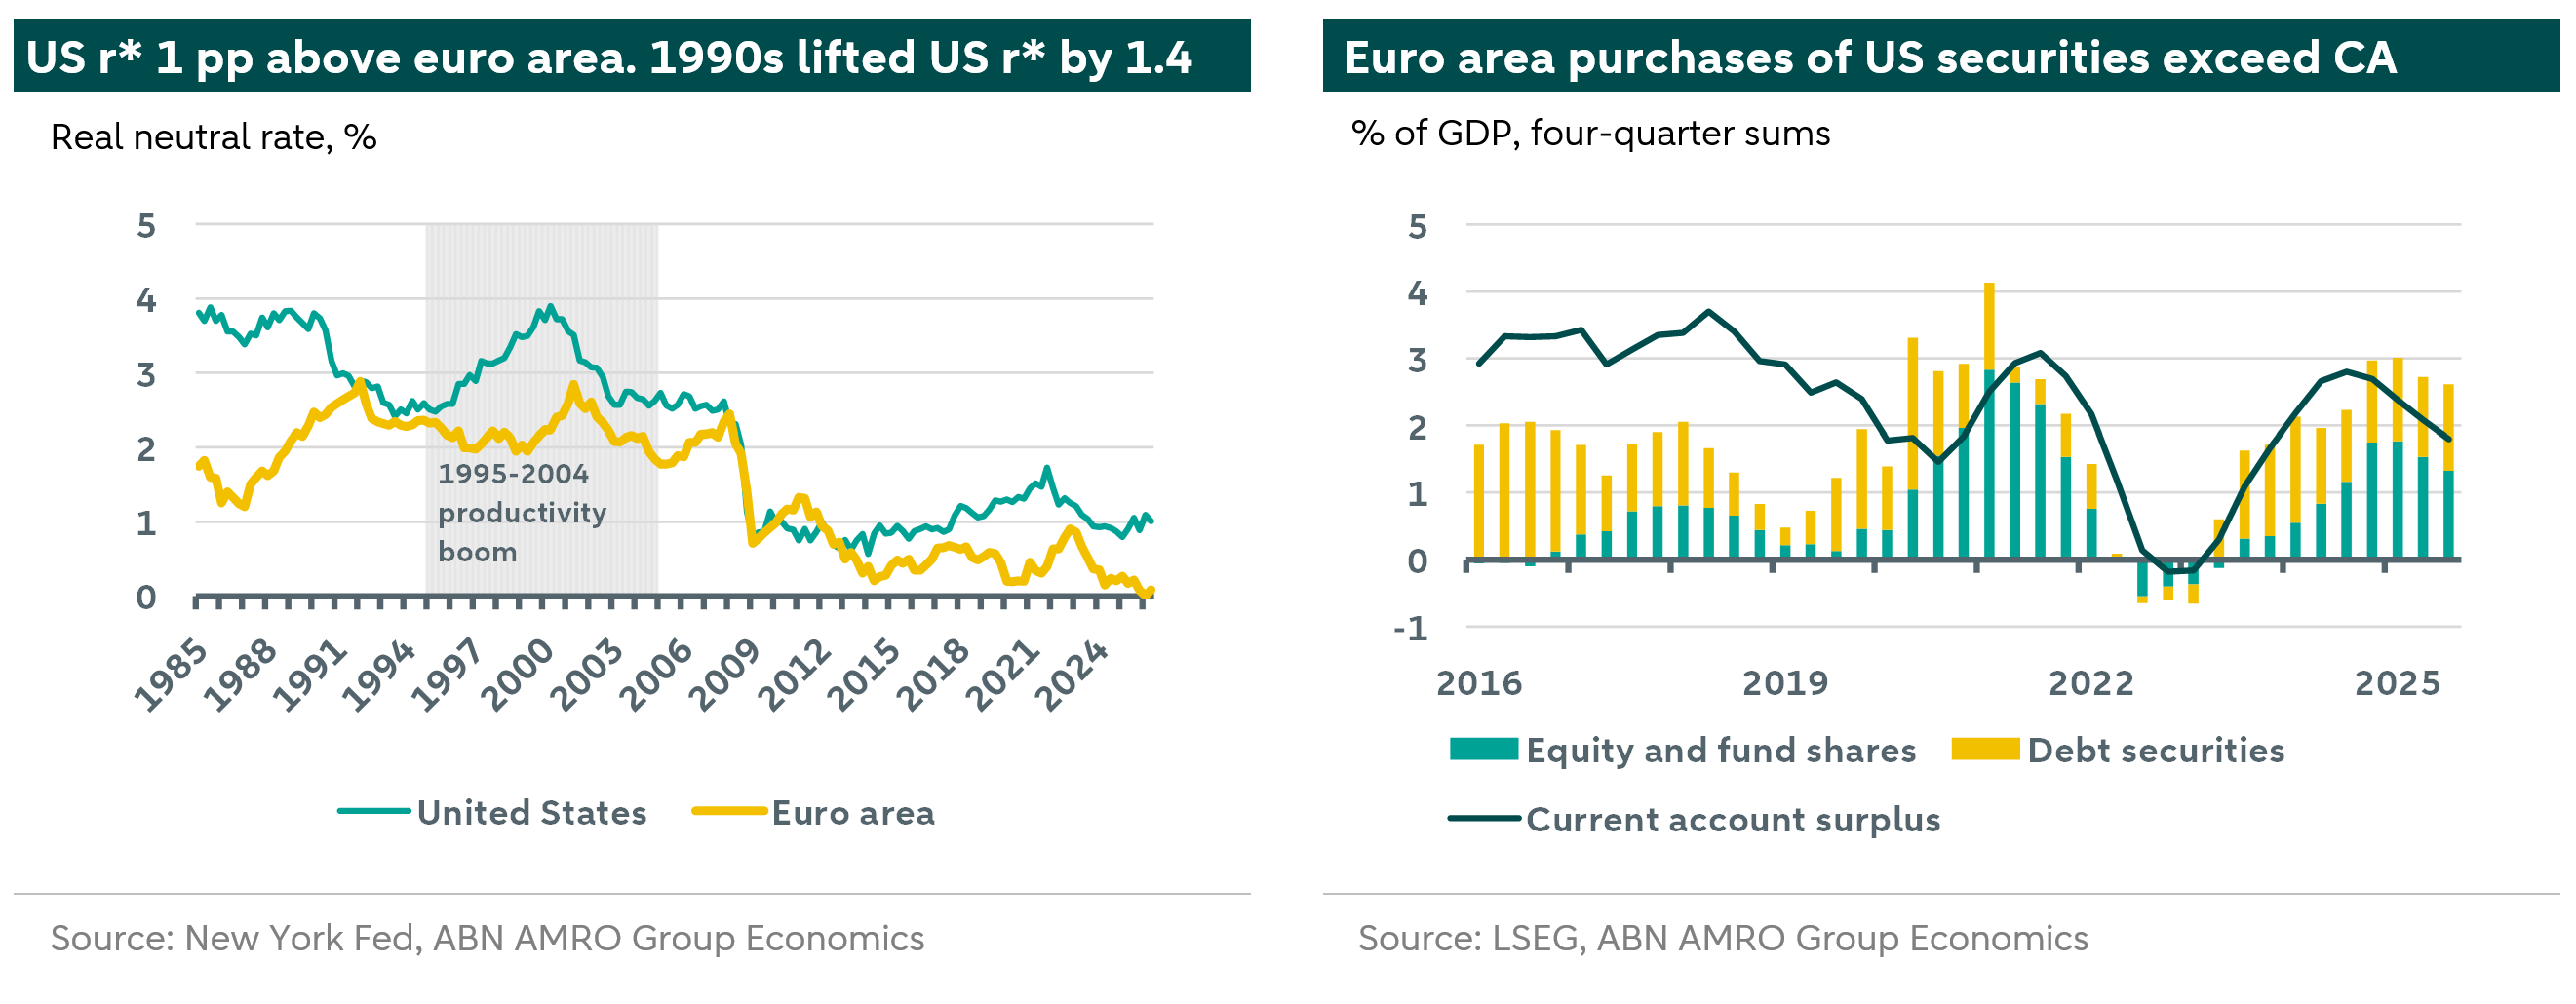
The US builds AI; the euro area mainly adopts it. In 2027, the combined capex impulse from AI, defence and clean energy is about 1.6% of GDP in the US and 0.3% in the EU, where clean energy and defence dominate. The last productivity boom shows what such a gap means for r*. Between 1995 and 2000, US r* rose by 1.4 pp while the euro area estimate stayed broadly flat. Today, model estimates put US r* at around 1.0% and euro area r* close to zero, a gap of about 0.9 pp that has widened since 2023. Three pieces of evidence suggest the AI part of the gap will last at least through the build-out.
Europe’s savings help pay for the US build-out
In the four quarters to Q3 2025, euro area residents bought EUR 409bn of US securities, 2.6% of GDP and more than the entire current account surplus of 1.8%, against about 1.4% of GDP before the pandemic; roughly half went into equities, where AI firms dominate. That helps meet US investment demand, softening the rise in US rates and leaving euro area rates largely untouched. Europe joins the build-out as an investor, not a producer.
AI barely moves euro area rates
On the average AI capex news day, expected ECB rates rise by 0.9 bp, less than half the US move, and the 10-year yield by 0.5 bp, neither of them significant. US fiscal news does reach the euro area, but differently: on those the euro area term premium rose by about 6 bp while expected ECB rates fell by about 4 bp.
Europe imports the US term premium, not US growth
Expected policy rates follow the ECB and euro area conditions. The term premium, the extra return for holding long-dated bonds, is set in one global market in which investors switch between Treasuries and Bunds, so more US duration raises its price everywhere. Since 2015, around 60% of monthly changes in the US term premium have reached the euro area, and about half of the euro area’s 108 bp rise since late 2022 came from the US.
Europe imports a small r* increase during the build-out, but productivity also pushes r* higher
We allow for an AI investment push of 0.1–0.3% of GDP in the euro area itself, plus 20–40% of the US effect through global capital markets. That gives a lift to the euro area neutral rate of about 0.1 pp over 2026–30. For productivity, we assume the euro area eventually gets the same gain as the US. But since an adopter can buy the technology rather than build it, the euro area needs less new capital. A broad boom then adds about 0.75 pp to euro area r*; concentrated or smaller gains add 0 to 0.3 pp.
The backdrop: other capex, demographics and climate act on the same curves
AI lands on a neutral rate that other slow-moving forces are already shifting. Most push the same way as the build-out; only a lasting climate hit to productivity pulls r* down.
Other capex
Global energy investment reached about USD 3.3 trillion in 2025 (IEA, 2025). Energy transition, grid and adaptation are the largest part of capex in Europe, where defence spending is also rising towards NATO’s core target of 3.5% of GDP by 2035. Both raise desired investment or public borrowing, and with it r*: by the mid-2030s, +0.05 to +0.15 pp in the US and +0.1 to +0.4 pp in the euro area, based on our capex estimates. They also compete with AI for grid equipment and connections.
Demographics
The euro area’s working-age population is set to shrink by 4% by 2040 (Eurostat EUROPOP2025), and US Social Security and health spending rises by 1.3 pp of GDP by 2036 (CBO, 2026). Ageing pushed r* down for decades and some expect that to continue (Auclert et al., 2021), but we think the balance now shifts as retirees draw down savings and pension and health spending adds to public debt (Goodhart and Pradhan, 2020). Applying CBO’s 2–3 bp per percentage point of debt-to-GDP to US debt rising to 120% of GDP by 2036, with a lower end for higher saving by older households, gives 0 to +0.6 pp for the US and +0.05 to +0.25 pp for the euro area. AI will not close the fiscal gap: Penn Wharton’s estimated USD 400bn deficit saving from AI over 2026–2035 covers about a sixth of the rise in US Social Security and health spending. In addition, narrowly distributed gains that push down the labour share of income could actually lead to lower tax revenues without changes to the system.
Climate
Under current policies, gradual warming could leave world GDP about 6% below its path by 2050, with floods, droughts and heatwaves adding to that. A broader set of estimates ranges from 1 to 8%. The damage builds up over time, so by the mid-2030s the drag on growth is about 0.2 pp a year. A lower return on capital and more precautionary saving pull r* down. Applying the same pass-through as for AI gives -0.1 to -0.2 pp in both regions by the mid-2030s, and more after that.
What the backdrop adds to r*
On balance, other capex, demographics and climate add about 0.25 pp to r* in both regions, which we add to every scenario from the mid-2030s. Ageing, public debt and other capex outweigh climate by a wide margin, so the backdrop keeps r* up even if AI disappoints. We estimate a range of −0.15 to +0.65 pp in the US and -0.05 to +0.55 pp in the euro area.
Putting it together
The pieces combine into six paths: the build-out; four long-run outcomes – broad boom (large, shared gains), winner takes all (large, concentrated), slow burn (small, shared) and disappointment (small, concentrated); and a boom-bust on the way to any of them. All start from today’s Holston-Laubach-Williams estimates, and ranges combine the low and high ends of every input. They are illustrations, not forecasts, but they pin down the ranking: the build-out lift is the most certain part, and who gets the productivity gains matters as much as how large they are.
During the build-out, the US neutral rate rises to about 1.2% and the euro area’s to about 0.1%; both lifts fade once it ends. By the mid-2030s, only a broad boom lifts long-run US r* clearly, to about 2%; the other paths leave it at 1.3–1.6%. A bust would take it to about 0.9% at the trough. Euro area r* reaches 1% only in a broad boom and stays at 0.3–0.6% otherwise.
Inflation and the term premium move differently along these paths. The build-out adds to inflation now and should add to the term premium as borrowing grows. High productivity lowers inflation only during the transition, after which distribution
decides the term premium: broadly shared gains widen the tax base, while concentrated gains weaken it and add to transfer needs, pushing it up. A boom-bust pushes both up and then sharply down.
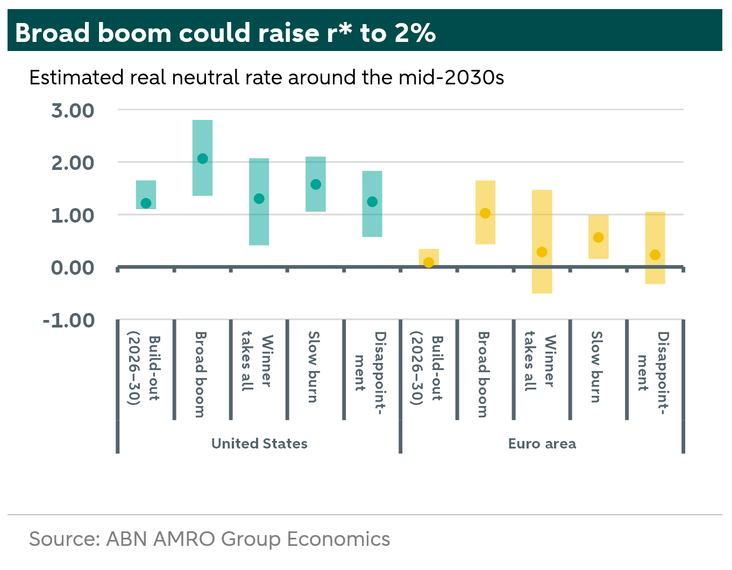
Our base case is the build-out followed by a slow-burn or winner-takes-all productivity phase. The US neutral rate then rises to about 1.2% during the build-out, and long-run r* settles at 1.4–1.6% by the mid-2030s, a nominal neutral rate of 3.4–3.6%, at or slightly above the Fed’s longer-run projection of 3.2%. Euro area r* ends at 0.4–0.6%, a nominal neutral rate of 2.4–2.6%. Given the financing trends and the revenue gap, we see a meaningful chance of the boom-bust path, which would take US r* back to around 0.9% at the trough, though not in the near term.
Surveys and market prices tell a different story for now. Surveys put the long-run policy rate at 3.25% for the Fed and 2.0% for the ECB: real rates of about 1.25% and 0%. Both sit below our estimates (1.4–1.6% and 0.4–0.6%), and for the euro area the survey matches today’s no-AI level. Market forwards are much higher, 5.2% for the US 5y5y and 3.6% for the euro area, above even a broad boom (about 4% and 3% nominal), but they include a term premium. To square forwards with our base case of a build-out followed by a slow-burn or winner-takes-all Phase 2, the term premium would have to be about 1.7 pp in the US and 1.1 pp in the euro area. A smaller term premium means markets price something like a broad boom. Surveys price no lasting AI lift, while markets leave room for one.