Transaction Trends - Cost of living improved despite more expensive groceries

Analysis of 150,000 Dutch households earning a salary provides insight into the development of the cost of living pressures. We examine the extent to which a household’s net income is consumed by fixed expenses and groceries. Grocery prices have increased significantly; households are spending more on them compared to seven years ago. Nevertheless, cost of living is improving because incomes have risen more sharply than fixed expenses and grocery expenses. The percentage of households that spend a large portion of their income on fixed expenses and groceries has decreased.


Cost of living remains highly relevant
During Budget Day (Prinsjesdag) and election campaigns, discussions* traditionally center around purchasing power. Since the previous elections, cost of living pressures has been added to these discussions. In the , the term "cost of living pressures" appeared as early as the third sentence, closely followed by "purchasing power." In a previous publication, we observed that the cost of living has improved for the average Dutch household over recent years. We noted that the proportion of net income spent on fixed expenses by households has decreased. However, in that publication, grocery expenses were excluded from our analysis. This publication complements our earlier work by including those expenses as well. Despite this addition, our conclusions remain unchanged. Since 2019, households have retained a larger portion of their income after deducting fixed expenses and grocery expenses. These findings align with other research conducted by the(Netherlands Bureau for Economic Policy Analysis). However, these average outcomes do not apply to all households. While the proportion of households spending a (too) large part of their income on fixed expenses, including groceries, has decreased, it still remains noticeable.
*We use cost of living pressures as a translation for the Dutch term “bestaanszekerheid”. The term "bestaanszekerheid" refers to the assurance that individuals or households have adequate resources to meet their basic needs.
For this study, we use anonymized and aggregated transaction data. We analyze the proportion of income households allocate to fixed expenses and groceries from July 2019 to August 2025. This observation period encompasses several shocks, such as the pandemic, the energy crisis, and the period of high inflation. By utilizing anonymized transaction data, we gain insights into actual household expenditures without relying on survey data. The focus of this research is specifically on households with income derived from salaries. Households whose income comes from benefits, pensions, or self-employment are excluded from this analysis. In total, our analysis group comprises approximately 150,000 households.
Fixed expenses and groceries as indicators of cost of living pressures
We interpret cost of living pressures as the extent to which households are able to respond to unexpected events that have a financial impact. This definition aligns with a recent of definitions by the European Commission and is also used as a perspective in the . An unexpected financial event could involve a large expense or a sudden loss of income. In our earlier work, we focused solely on fixed expenses as a share of income. Fixed expenses refer to costs that households are 'tied to,' such as rent and housing costs, health insurance, and subscriptions. As fixed expenses take up a larger portion of income, households have less flexibility to cope with unexpected expenses. However, fixed expenses as a share of income alone do not tell the full story. Grocery expenses, which are also essential and constitute a basic need, have significantly increased in price in recent years. In this publication, we therefore combine grocery expenses with fixed expenses to assess the financial flexibility of households.
Food prices have risen sharply
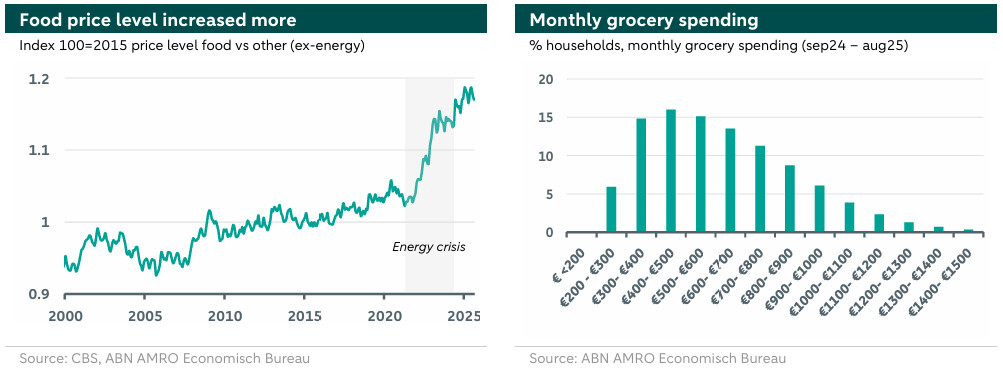
Grocery prices, defined here as food prices, have risen significantly in recent years. Compared to three years ago, food prices are roughly 20% higher. In fact, the price of food has increased more sharply than the price of other products. This relative relationship between food prices and other prices is illustrated in the left-hand graph below, which shows the ratio between the price level of food and other products (excluding food and energy). Since roughly the energy crisis, a clear structural break is visible, with the price level of food increasing more rapidly than that of other products.
indicates that food prices have a greater impact on households' inflation expectations compared to the prices of other goods and services. This is likely because households frequently observe these prices on supermarket shelves—a phenomenon known as the ‘sticker effect’. The recent absolute and relative rise in food prices may therefore contribute to the among households.
Different grocery baskets
How much do households typically spend on groceries? We examine the average monthly grocery expenses per household over the past year (September 2024 to August 2025). We opted for a monthly average calculated over a year because grocery expenses show significant seasonal fluctuations, such as increased spending during the December holiday season. To provide the most comprehensive picture possible, we use a broad definition of grocery expenses in our analysis. In addition to spending at supermarkets (physical and online) and meal kit delivery services, we also include expenditures at specialty stores such as bakeries, butcher shops, fishmongers, delicatessens, and liquor stores.
The right-hand graph above shows the distribution of monthly grocery expenses for the households in our analysis group. We observe considerable differences among households. Approximately 45% of households spend between 300 and 600 euros per month on groceries. Three-quarters of households have grocery expenses of up to 785 euros. The median household in our analysis spent 585 euros per month on groceries over the past year, which is roughly 150 euros per week. These results are broadly consistent with the budget survey data from Statistics Netherlands (CBS)*.
*The average grocery expenses (categories 0100 and 0200), adjusted to 2025 price levels, amount to approximately 640 euros per month according to CBS.
Grocery expenses are increasing over time, …
Total grocery expenses can be influenced by many factors. Higher prices, for example, directly impact monthly spending. In addition, consumer behavior plays a role. Households may choose to purchase cheaper alternatives, such as private-label instead of brand-name products, shop at different stores, or adjust their consumption patterns by buying less. Substitution between dining out and groceries also affects total grocery expenses. This raises the question: how have actual grocery expenses developed over the years?
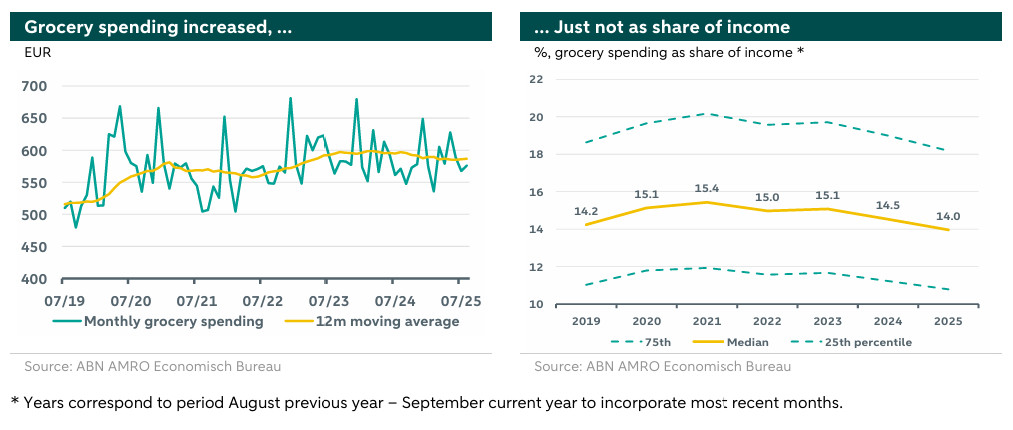
In the left-hand figure below, the median monthly grocery expenses are shown in green, alongside the same series represented as a rolling annual average in yellow. In addition to a clear seasonal pattern, such as increased spending during the December holiday season, we can also observe the start of the COVID pandemic in March 2020. Due to lockdowns, spending shifted from dining out to groceries. The rising rolling average demonstrates that households are spending significantly more on groceries in 2025 than they did in 2019. Grocery expenses over the past seven years have increased from approximately 520 euros per month to around 585 euros per month.
… but not as percentage of income
What stands out when we compare the absolute increase in grocery expenses to income? The right-hand figure above shows that a median household spent approximately 14% of its income on groceries in the past year. This share is similar to that of 2019. In the intervening years, we observe an increase, peaking at 15.4% in 2020-2021. This rise in the relative share can be attributed to the additional grocery expenses during the COVID lockdowns. Although the absolute amount spent on groceries continued to increase afterward, the ratio between grocery expenses and income did not rise further. Over recent years, income growth has outpaced grocery expenses. Cost of living improved despite more expensive groceries
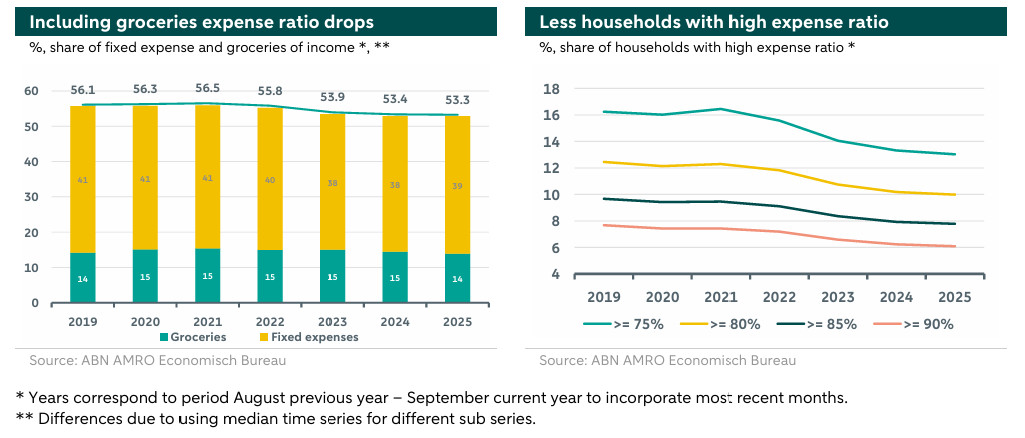
We now combine our earlier analysis on households' fixed expenses with our new analysis on grocery expenses. The left-hand figure below shows the percentage of income spent on fixed expenses and groceries combined. Between 2019 and 2025, this percentage decreases from 55.5% to 52.5%. This decline is due to fixed expenses taking up a smaller share of income. As a result, households retain a larger portion of their income after deducting expenses for fixed costs and groceries. The findings from our previous analysis on fixed expenses—that median households have experienced improved cost of living relative to income—remain unchanged, even when grocery expenses are included.
A smaller group of households faces a structural problem
The above conclusions apply to median households but do not hold true for all households. A high ratio between grocery expenses, fixed expenses, and income suggests limited financial flexibility to respond to shocks, such as a significant expense or sudden loss of income. Therefore, we focus on households that consistently have a high ratio.
The right-hand figure below shows the percentage of households in our analysis group with a ratio exceeding 75%, 80%, 85%, and 90%. Currently, 13% of households spend more than three-quarters of their income on fixed expenses and groceries. Overall, a clear decline in this percentage is observed, suggesting that a larger share of households has gained financial flexibility to make other expenditures and cover unexpected costs. This is a positive development. However, a non-negligible share of households continues to have a persistently high ratio. For example, approximately 10% of the households in our analysis group of 150,000 households have a ratio of necessary expenses to income exceeding 80%.
Conclusion
With the upcoming elections and government formation, cost of living pressures and purchasing power are likely to regain attention, especially due to the persistently higher inflation in the Netherlands compared to neighboring countries. Our analysis provides a current snapshot of approximately 150,000 households, whose primary income source is a salary, up to August 2025, focusing on one measure of cost of living: the percentage of income spent on fixed expenses and groceries.
In our analysis, we observe that despite the absolute increase in spending on fixed expenses and groceries, these expenses as a percentage of income have decreased. This indicates that households have more financial flexibility to handle unexpected setbacks. After deducting these essential expenses, the median household in 2025 retains a larger share of its income compared to 2019. However, this does not apply to all households. There is significant variation in grocery spending, both in euros and as a percentage of income. A non-negligible number of households still have a very high ratio of necessary expenses to income.
From this, we can draw two key conclusions: 1) The necessity for broad-based purchasing power support for the average household has diminished compared to previous years, given the improved ratios between income and essential expenses. 2) To maximize impact, purchasing power support should be more effectively targeted at households with limited financial flexibility and a persistently high proportion of income spent on essential costs.
Data, Method and Definitions see PDF