Transaction Trends - Drivers are buying less fuel and watching their spending

Fuel prices have risen this year due to higher fuel excise duties and the war in Iran. Drivers are reducing fuel consumption in response to higher prices. Since March, consumption has been approximately 12% lower than a year earlier. As a result, the increase in fuel spending was limited to 6% year on year. Drivers in lower-income groups and urban areas reduced their fuel consumption relatively strongly. Growth in non-fuel spending among drivers is as high as among other households. However, it differs by income: growth is lower among lower-income groups.


Energy prices much higher
The war in Iran has caused a global energy price shock. Energy prices are significantly higher than at the start of this year, raising concerns about households' financial position. In our previous publication, ‘Keeping a finger on the pulse of higher energy prices’, we showed that higher gas and electricity costs pass through only gradually because of long-term contracts, whereas drivers face higher fuel costs almost immediately and therefore spend more on fuel. Because drivers are the first and most directly affected by higher energy prices, they are an interesting group for analysing how energy price shocks feed through to the broader economy. Does a price shock mainly lead to an adjustment in fuel consumption, or do drivers absorb it by spending less on other goods and services? This matters not only for drivers themselves, but also for the wider economy. If drivers mainly reduce fuel consumption or try to absorb the additional fuel costs by saving less, the short-term effects of an energy price shock on the real economy remain largely confined to inflation. If, by contrast, they also cut other expenditure, the shock leads to weaker demand and lower economic growth.
Using our anonymised and aggregated transaction data, we examine the extent to which drivers have reduced their fuel consumption and whether they have adjusted their spending on other goods and services
Drivers shift refuelling in anticipation of price changes
Our transaction data allows us to observe whether drivers adjust their refuelling behaviour in response to price shocks. By dividing the refuelling amount by Statistics Netherlands' average daily petrol price, we can estimate how many litres of fuel drivers purchase. This estimate approximates the actual number of litres because we do not know exactly which type of fuel was purchased. As we are primarily interested in drivers who are most exposed to fuel-price fluctuations, we restrict our study group to those who refuel regularly, whom we call ‘active drivers’. We also exclude households living in border regions, where drivers may choose to refuel abroad, to avoid distorting the results. However, we have not adjusted for the possibility that drivers use lower-priced filling stations, so the actual number of litres purchased is probably slightly higher than our estimate.
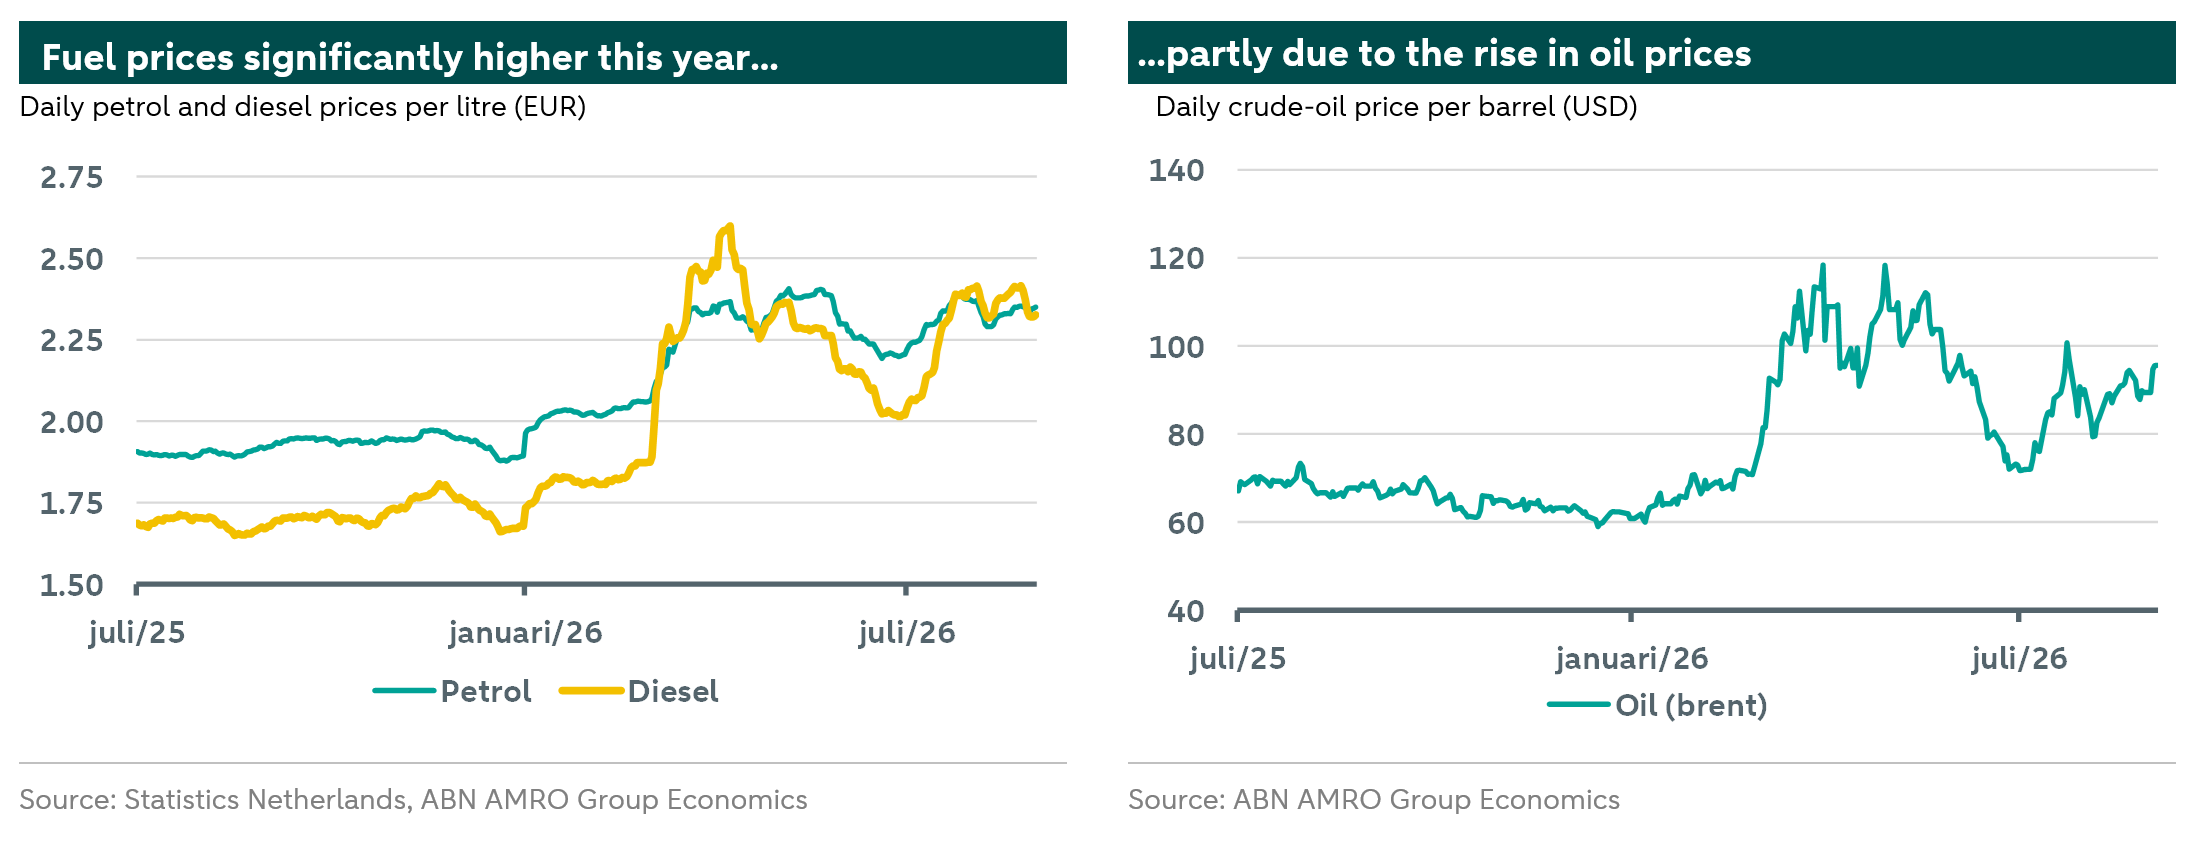
Around both the turn of the year and the outbreak of the war in Iran, the number of litres purchased deviated sharply from the level suggested by the historically indexed trend. Volumes fluctuated substantially from day to day. There is a clear anticipation effect around the excise-duty increase on 1 January 2026: active drivers filled their tanks before the planned increase. On the 30th and 31st of December, they bought far more fuel than the indexed trend would have suggested. On 1 January, this pattern reversed and purchases were much lower. The number of litres purchased then remained below trend for around two weeks before gradually recovering. Cold weather in early January may have contributed to the duration of the decline.
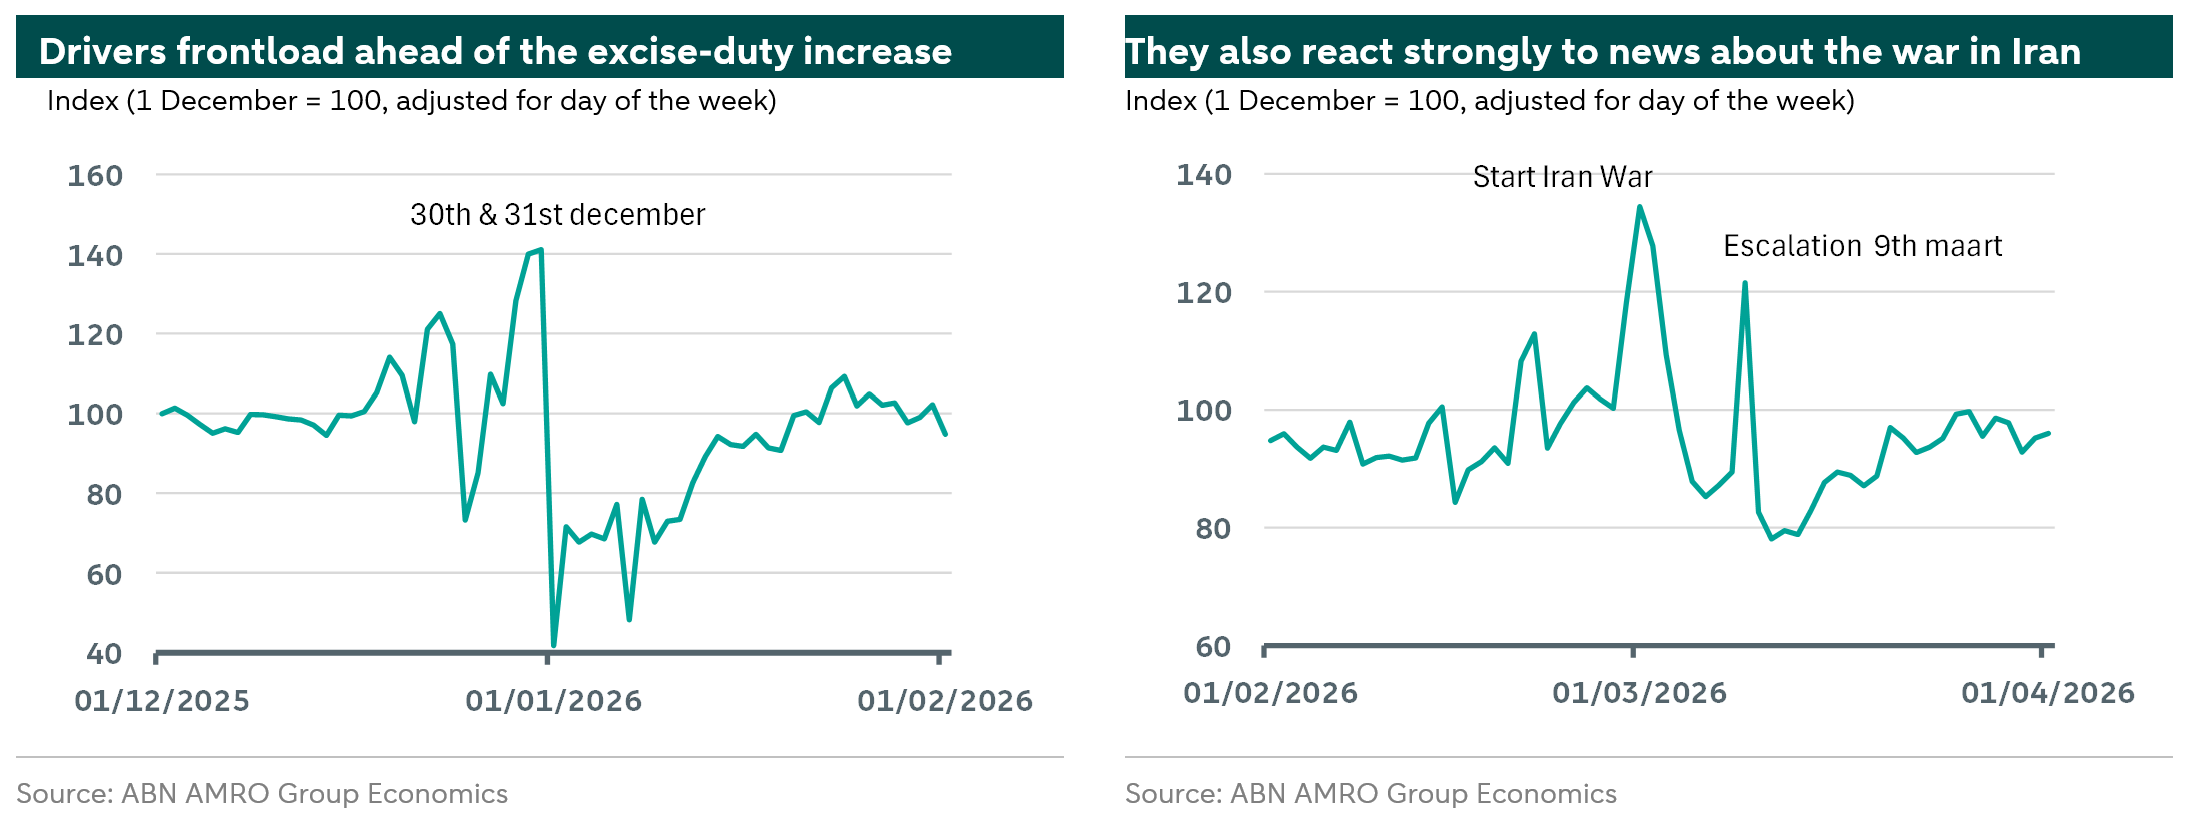
The second chart also shows a clear anticipation effect around the 28th of February, when the war began. The number of litres purchased was far above the indexed trend. A second peak is visible on the 9th of March. On that day, the price of Brent crude rose by around 30% to approximately USD 120 per barrel following media reports of a sharp escalation in the conflict. Many drivers brought forward their refuelling because they expected pump prices to rise sharply as well. This underlines that pump prices do not need to change immediately to trigger behavioural responses. Expectations of future price increases, fuelled by news of geopolitical threats, can also prompt drivers to change their refuelling behaviour.
High prices curb demand for fuel
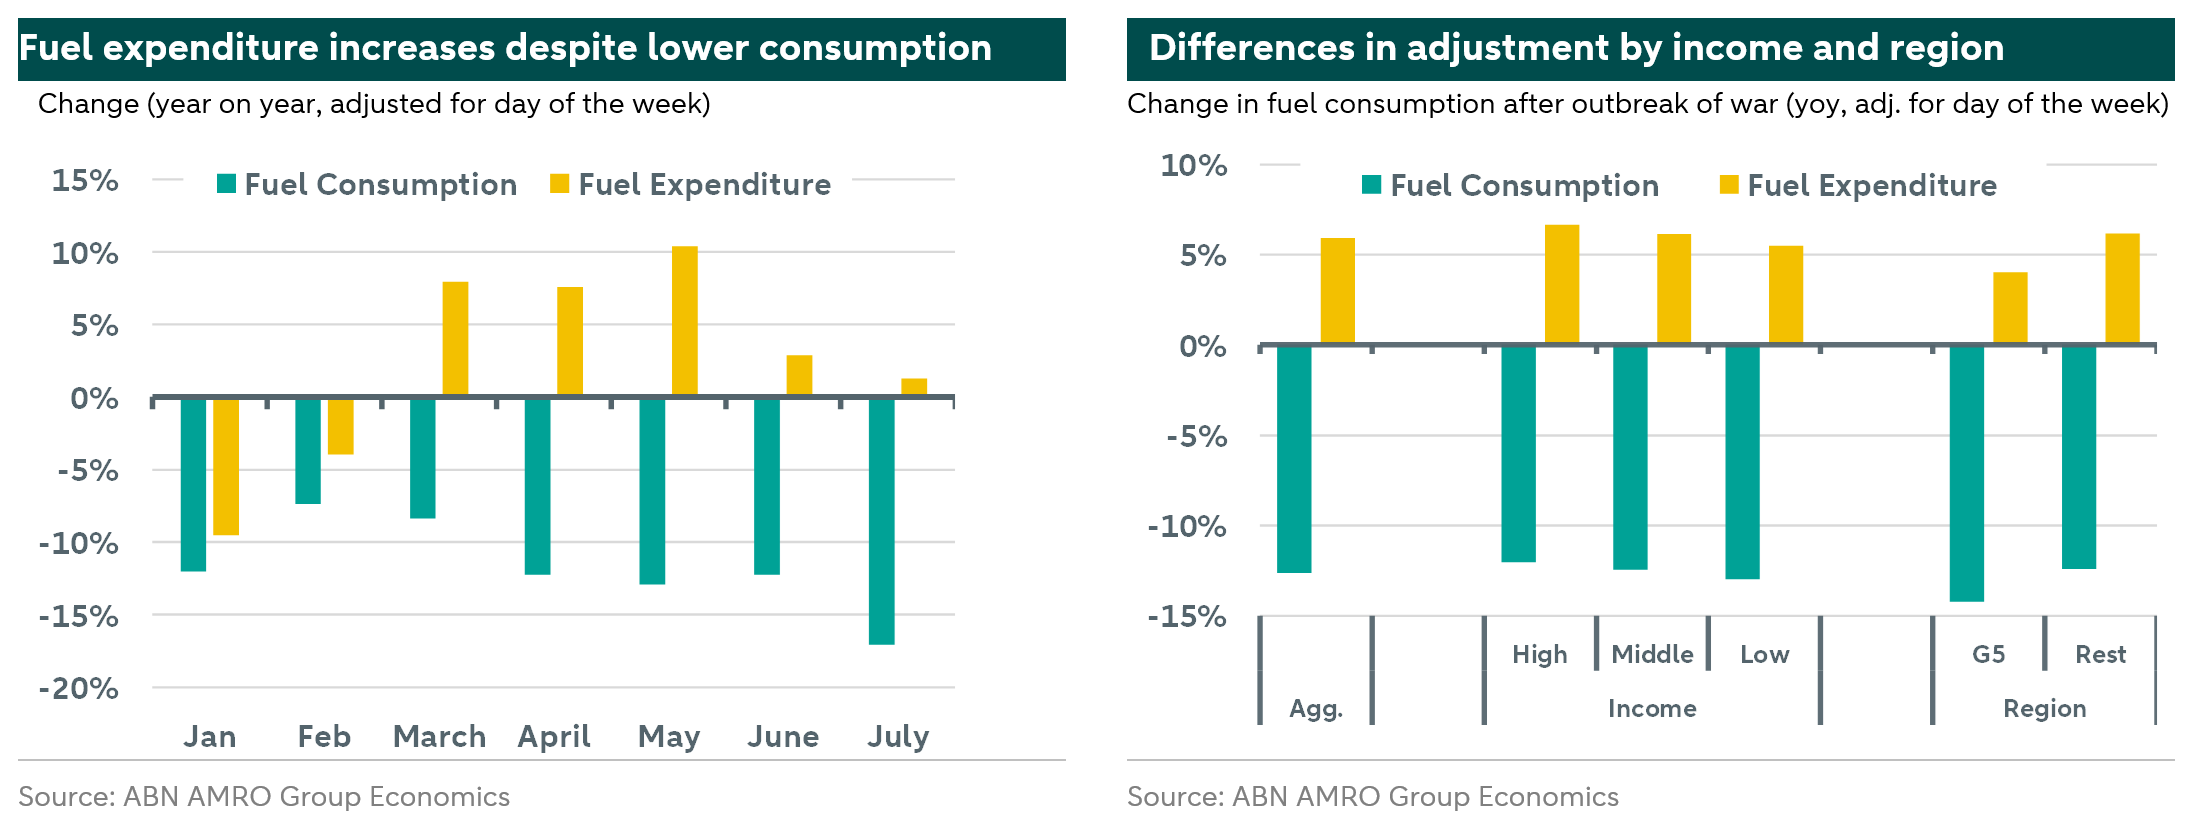
In addition to frontloading in anticipation of possible price changes, active drivers also appear to reduce fuel consumption when prices rise. The chart on the left on the following page shows that, between March and July, the average active driver's monthly fuel purchases, an indicator of fuel consumption, fell by 12% compared with the same period a year earlier. Last year, the amount of fuel purchased was around 90 litres per month. This year, it is approximately 80 litres.
The chart also shows that fuel spending declined year on year in January and February, in line with consumption. From March onwards, however, the two series begin to diverge. While fuel consumption continued to fall, fuel spending increased. From March onwards, fuel spending was 6% higher than a year earlier. For the typical active driver, this amounts to an increase of approximately EUR 10 in monthly fuel spending, to EUR 150
The chart suggests that active drivers are becoming increasingly successful at reducing their fuel consumption over time. Owing to a lack of data, we cannot yet establish this with certainty, but the finding would be consistent with earlier indicating that price elasticity gradually increases after a price shock. Drivers need time to adjust their fuel consumption and may use several strategies: driving less, making shorter trips or driving more efficiently; working from home; carpooling; switching to another mode of transport; or buying a more fuel-efficient car.
A breakdown by income reveals small differences between active drivers. Drivers in lower-income groups appear to reduce consumption slightly more than high-income drivers: 13% versus 12%. The difference is somewhat larger when the data is broken down by area of residence. We distinguish between people living in Amsterdam, Rotterdam, The Hague, Utrecht or Eindhoven, the five largest cities (G5), and those living elsewhere in the Netherlands. Our data shows that active drivers in the five largest cities reduced fuel consumption by 14% year on year, compared with 12% among those living elsewhere. The explanation is probably less about the need to adjust consumption, as with the income differences, and more about the scope to make adjustments, which is likely to be greater in urban areas.
Other spending remains resilient, at least at the aggregate level
So far, we have seen that households responded to the fuel-price shock by substantially reducing fuel consumption. Nevertheless, active drivers still spend more on fuel than before the war. To assess whether this affects their other expenditure, we use a difference-in-differences analysis to compare changes in their other spending on groceries, restaurants, other debit-card transactions, online purchases and cash withdrawals with the same types of expenditure by other households. A difference in spending growth after the price shock would indicate that active drivers adjusted their expenditure.
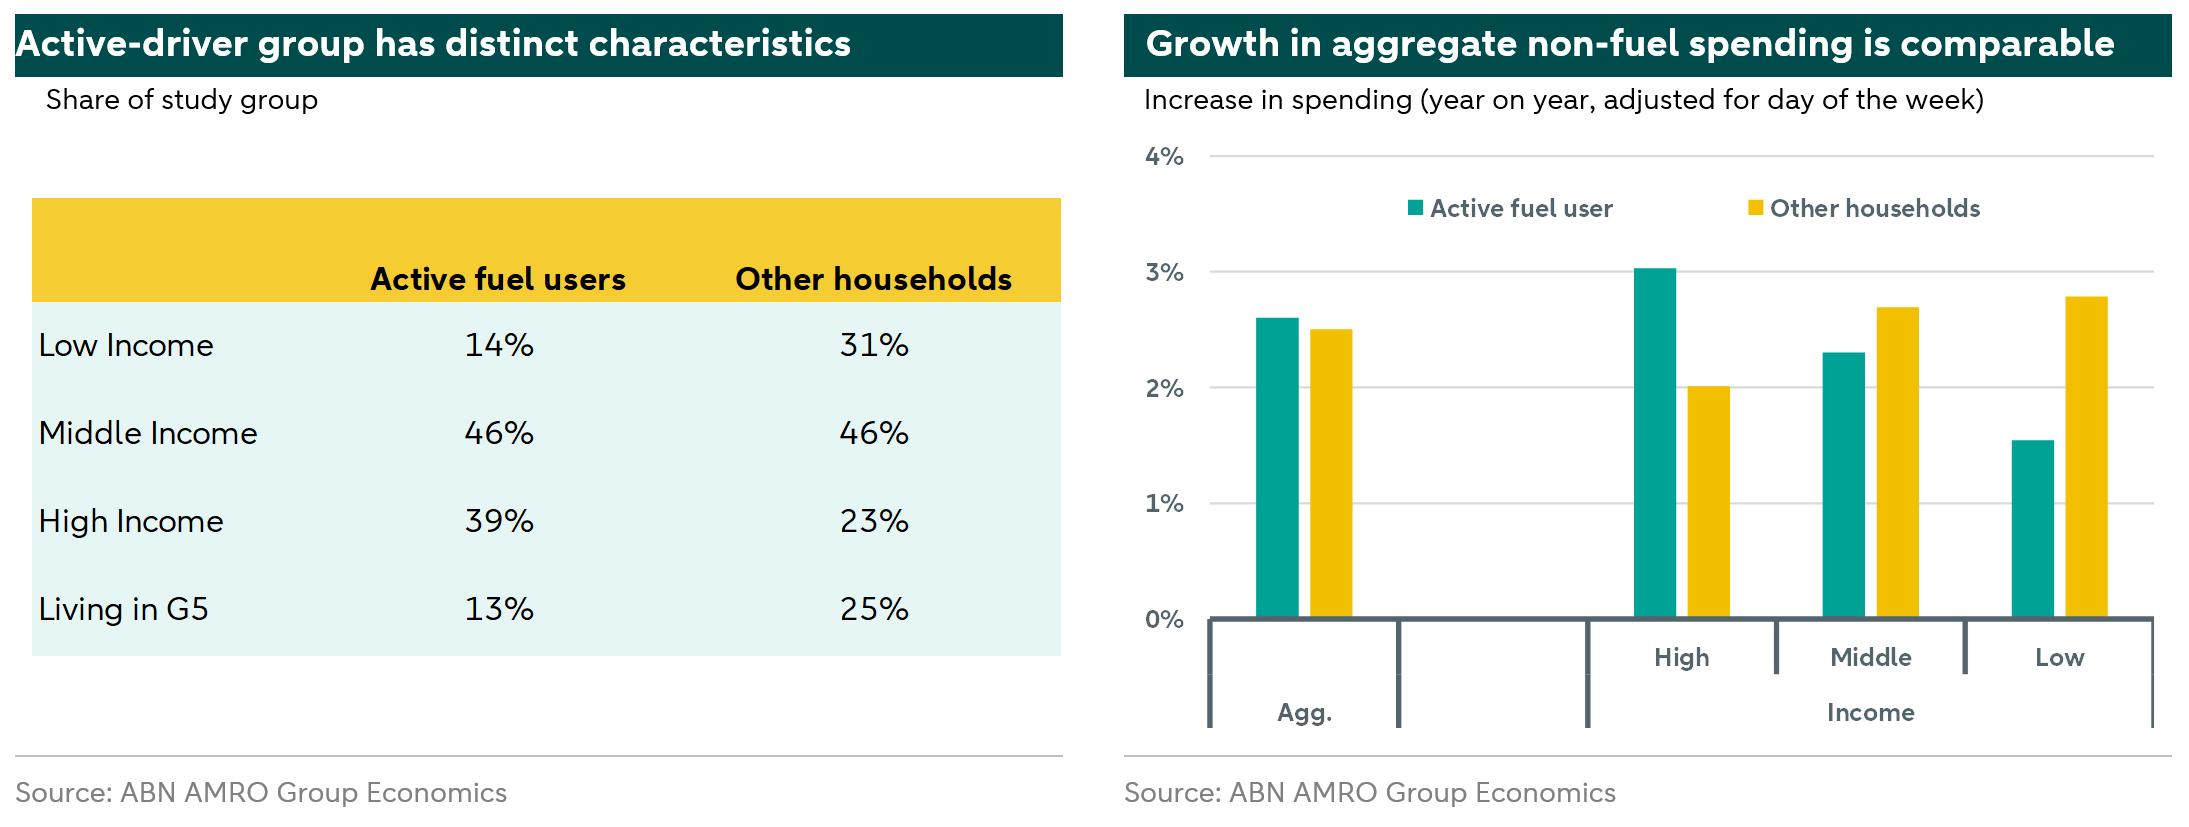
At the aggregate level, the chart on the right shows no difference in spending growth between active drivers and other households. This may be because the additional amount spent on fuel by active drivers is relatively limited, given the reduction in fuel consumption. Another explanation is that the two groups have different background characteristics. Drivers who refuel regularly are more likely to have a high income and to live in less urban areas than the comparison group. A further split by income and region reveals that more is happening beneath the surface. Although there is no significant difference in spending growth by region, the income split does indicate that the low-income group is adjusting its expenditure. Spending growth among active drivers in the low-income group is 1.3 percentage points lower than in the control group. It is 0.4 percentage points lower in the middle-income group, whereas spending growth in the high-income group is 1 percentage point higher. This suggests that active drivers adjust their spending in response to higher fuel costs in different ways depending on their income. Earlier research by points in the same direction. That study also found that drivers report saving less, a response for which we cannot control.
It is unclear why spending growth among high-income drivers is higher. One possible explanation is that they travel by public transport more often or have purchased an alternative means of transport. The fact that the higher growth is mainly driven by debit-card and online payments points in that direction, but we cannot establish this with certainty.
Economic implications and policy considerations
Drivers respond strongly to changes in fuel prices resulting from the excise-duty increase and the war in Iran. The sensitivity of refuelling behaviour to fuel prices was also evident in our of cross-border fuel tourism.
Drivers also adjust their fuel consumption in response to price increases. By reducing consumption, they limit the eventual increase in their costs. They appear to become increasingly successful at doing so over time.
At the aggregate level, other consumer spending by active drivers is rising at almost the same rate as spending by other households. The continued increase in consumer spending is consistent with Statistics Netherlands' national growth figures, which show that household consumption rose in the second quarter despite international uncertainty. One possible explanation for the limited slowdown is that the labour market was relatively tight before the war and many households had substantial financial buffers.
Breaking the results down by income and region reveals differences in how drivers respond to price increases. Low-income drivers reduce their fuel consumption and spending slightly more than high-income drivers, probably because they have fewer resources with which to absorb the shock. Drivers in the five largest cities also reduce their fuel consumption more than drivers elsewhere in the country. One possible explanation is the greater availability of transport alternatives.
The strong sensitivity of fuel consumption to prices shows that price signals help bring about the necessary adjustment in demand when supply is suddenly constrained. This suggests that policymakers should be cautious about broad measures that weaken the price signal, such as a reduction in fuel excise duty.
Finally, support for drivers should be designed as precisely as possible and should take account of differences in financial capacity and the availability of transport alternatives in the area where people live. This is consistent with earlier recommendations by, among others, the IMF and the ECB.