A new Fed Chair in a more fragile Treasury market

Fed Chair transitions have historically been followed by higher Treasury yields, as markets reprice policy uncertainty and the incoming Chair’s reaction function. This post-transition rise in Treasury yields is still yet to materialize. Any repricing under Warsh may be more persistent than in past transitions because he takes over an already fragile Treasury market. Warsh’s preference for lower rates may support the front-end of the curve, but concerns about political pressure, reduced transparency and conviction-based policymaking could keep term premia and long-end yields under upward pressure. Even a gradual reduction in the Fed’s balance sheet would matter for Treasuries, because it raises free float and shifts more duration risk onto investors with less stable demand. Rising Treasury issuance and a worsening fiscal backdrop mean that higher yields increasingly feed back into debt-servicing costs, rollover risk and term premia. The shift away from foreign and official buyers toward more cyclical domestic investors makes Treasury demand less stable, reducing the market’s ability to absorb growing supply without higher term premia.

Introduction
Kevin Warsh was sworn in as the new Chairman of the Federal Reserve at the end of May. As highlighted in a previous note (here), he inherits a difficult environment in which the Fed must balance inflation risks against political pressure. In this note, we assess what a new Fed Chair means for US Treasuries. The historical pattern is fairly clear: transitions at the top of the Fed tend to generate a period of lower yields before the handover, followed by a repricing higher once the new Chair takes office. But history is only part of the story. This time, the starting point also matters: the Treasury market is already dealing with elevated term premia, rising supply and a changing investor base. Put differently, this leadership change is taking place when the Treasury market is structurally more fragile than in past transition episodes.
What history tells us
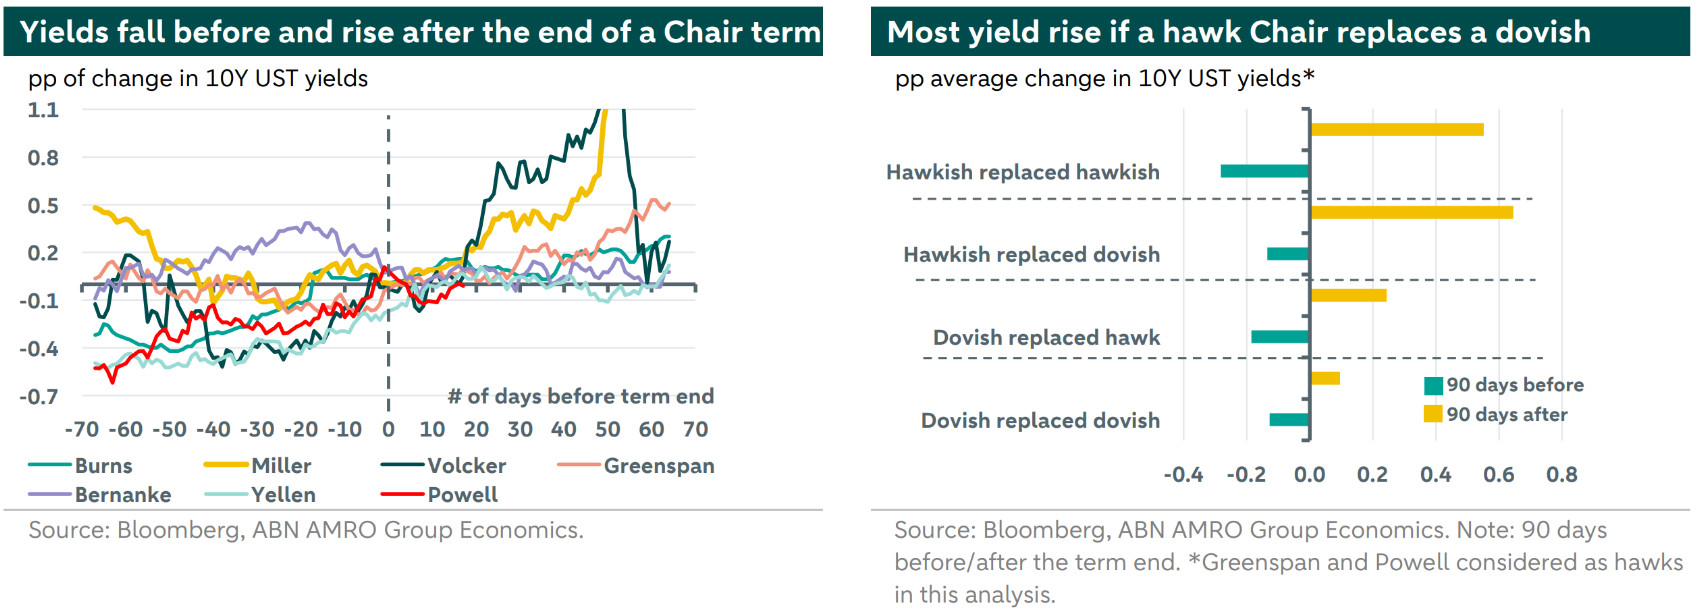
It is useful to look back at past Fed Chair transitions to understand how Treasury yields behaved during those episodes. History matters here not because every Fed transition looks the same, but because leadership changes tend to create a temporary policy vacuum. Markets start asking whether the new Chair will preserve the existing reaction function or shift it. Our analysis of the seven Fed Chair transitions between 1969 (Burns) and 2026 (Powell) suggests a fairly consistent pattern: yields tend to fall ahead of the end of a Chair’s term and rise after the handover. More specifically, 10Y Treasury yields fall by an average of 0.16pp in the 90 days before the end of a Fed Chair’s term, and rise by an average of 0.375pp in the 90 days after. One explanation for this is that investors demand greater compensation for risk when the policy framework becomes harder to read and communication practices may change. However, averages and medians alone can obscure the fact that Fed Chair transitions have differed substantially from one another.
Our analysis indicates that the rise in yield tends to be larger when a dovish Fed Chair is replacing a hawkish one. In this case, 10Y bond yields rise by as much as 0.64pp within the 90 days following the end of a Chairman term. Not surprisingly, the next largest increases occurs when a hawkish Chair is replaced by another hawk, with yields rising by 0.55pp (see right chart on the next page).
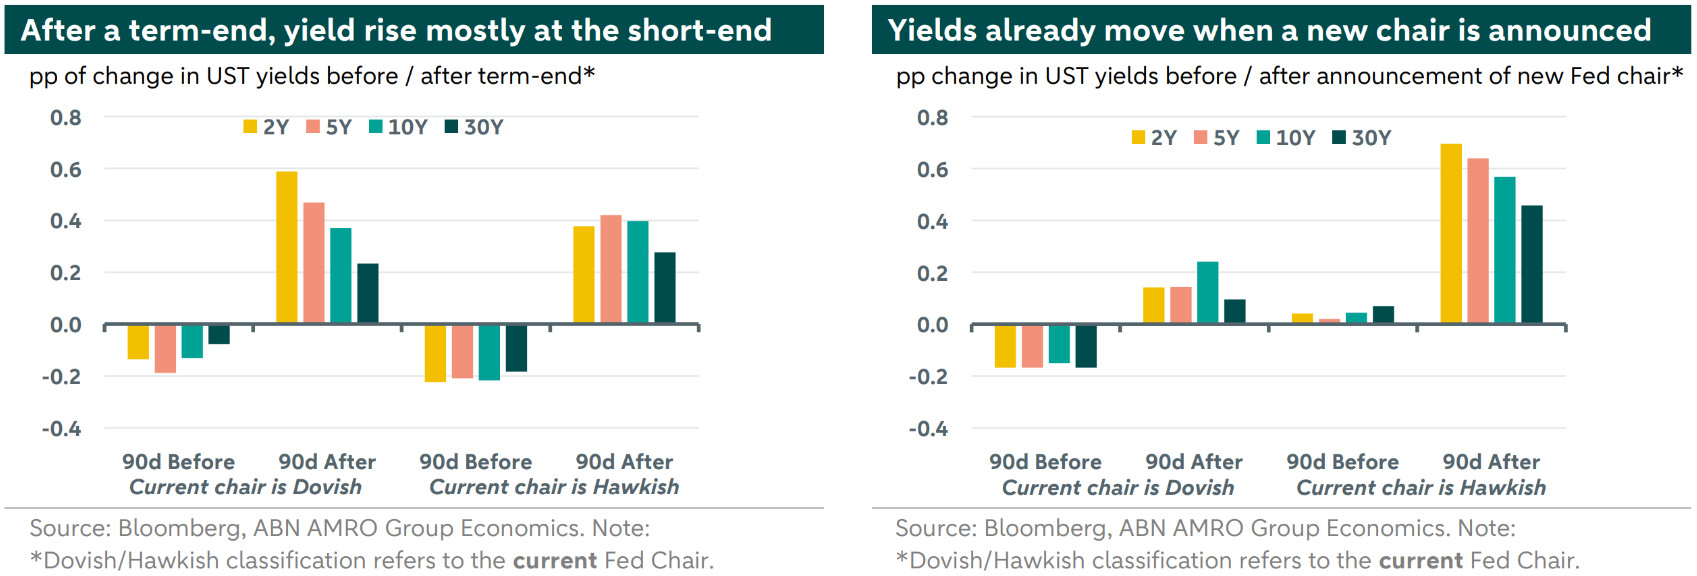
Furthermore, the re-pricing is also not uniform across the curve. Because Fed Chair transitions are associated with potential changes in the monetary policy stance, yields at the short end of the curve, which have a greater sensitivity to near-term policy expectations, react more aggressively than in the long-end. Accordingly, 2Y and 5Y Treasury yields tend to rise more sharply than 10Y and 30Y yields (see left chart below).
Just as importantly, the repricing does not wait for the swearing-in. Once the market has a name, it begins to trade the possible policy mix behind that name. That can matter even more for yields at the long-end of the curve, where investors are trying to price not only the path of rates but also the credibility and durability of the policy framework. In other words, the appointment itself can become a macro event. This is illustrated in the right chart below. The move in yields around the announcement is particularly meaningful when the outgoing Fed Chair is hawkish. That said, the results are somewhat skewed by the Volcker episode (a hawk), when Treasury markets repriced sharply after it was announced that he would replace Miller, who was perceived as dovish (see left chart above).
Overall, history shows us that there is a repricing of Treasury yields after a Fed Chair transition, which is more significant at the short-end of the curve but can also be felt in the long-end. Since Warsh was sworn in, Treasury yields have edged lower, but overall the market has remained broadly flat. If one classifies Powell as hawkish (which is debatable) and Warsh as a dovish, the historical pattern would suggest that yields could still rise by roughly 0.2pp over the next 90 days following Powell’s term end on 22nd of May. Nevertheless, despite the magnitude, there is no precedent in the historical period analyzed that Treasury yields fall after a Fed Chairman transition.
Looking ahead: Will Warsh lower Fed fund rates?
Warsh has been vocal in arguing that AI-driven productivity gains could justify lower policy rates. Political pressure from the Trump administration has also created an implicit expectation that Warsh will deliver lower rates, although that could raise questions about the independence of the Fed. Our current base case assumes three consecutive cuts starting in December this year, although the strong payroll report of last Friday raises the case for rates to remain on hold for longer.
However, a more pressing issue for bondholders is the long-term outlook. Warsh has argued that policy should be conviction based rather than data-driven or forecast based. This raises the risk of policy remaining inappropriate for longer, particularly if policy is kept too accommodative for too long, which would push up term premia and therefore long-term rates. Furthermore, he has also argued for less transparency through less frequent communication from FOMC officials. This increases policy uncertainty and hence interest rate volatility, which could also translate into a higher term-premium.
Looking ahead: Warsh’s goal of reducing the Fed’s balance sheet
Despite some similarities regarding Treasuries’ behavior across Fed Chair transitions, each new Chair inherits a different environment and has different goals. One example is Warsh’s long-standing intention to reduce the Fed’s balance sheet, a goal that he has been vocal about for quite some time.
However, as we have previously written, we think that market constraints will prevent any quick action on this, and that a reduction would have to be gradual (here). There are three reasons for this. First, the Fed’s current framework relies on a fairly large stock of reserves in the banking system to keep overnight rates stable, implying that any sharp balance sheet reduction cannot be done without risking stress in money markets. The Fed has already seen the risks of shrinking the balance sheet too quickly, for example last year when a sharp rise in both the repo rates and the volatility between the Interest on Reserve Balance (IORB) and the Fed Funds rate (SFFR) forced the Fed to resume balance sheet expansion after years of QT (more here). Ultimately, the Fed must ensure that banks do not feel reserve-constrained, as otherwise they will start bidding aggressively in the overnight market, pushing the Fed Funds rate above the IORB.
The second reason is that the Fed also has a de facto mandate to preserve financial stability and ensure the proper functioning of key markets. In practice, this means that balance sheet reduction cannot be pursued regardless of market conditions. If liquidity in the Treasury market were to deteriorate (a scenario that becomes increasingly more likely given the fragility of the market), the Fed could likely be forced to intervene, as it did in March 2020 when it resumed Treasury purchases to restore market functioning after the Covid-19 shock. Admittedly, intervention would be more complicated this time. Inflation remains above target, fiscal policy is still expansionary, and any renewed purchases under Warsh could be interpreted as a weakening of Fed independence given his long-standing skepticism toward QE. Even so, the broader point remains: if market functioning were seriously impaired, financial stability considerations could quickly override ambitions to shrink the balance sheet.
Finally, the Treasury itself has huge refinancing needs and rising borrowing requirements, and a quick balance sheet reduction would significantly raise refinancing risks.
Even so, gradual does not mean irrelevant. A continued and gradual reduction in the Fed’s balance sheet would still increase the free float of Treasuries, meaning a larger share of the market would need to be absorbed by investors who are more sensitive to price and funding conditions than the central bank. For example, the QT undertaken under Powell has increased the share of Treasuries traded as free-float, which in turn raises the term premia (see left chart below). Furthermore, even in a scenario where balance sheet size remains the same but the overall maturity of its holdings is reduced (a shift towards a market-neutral portfolio or a “Reverse Operation Twist”), term premia would also have to rise. Hence, any balance sheet reductions (even if carried out slowly) still point to a structurally higher compensation for holding duration.
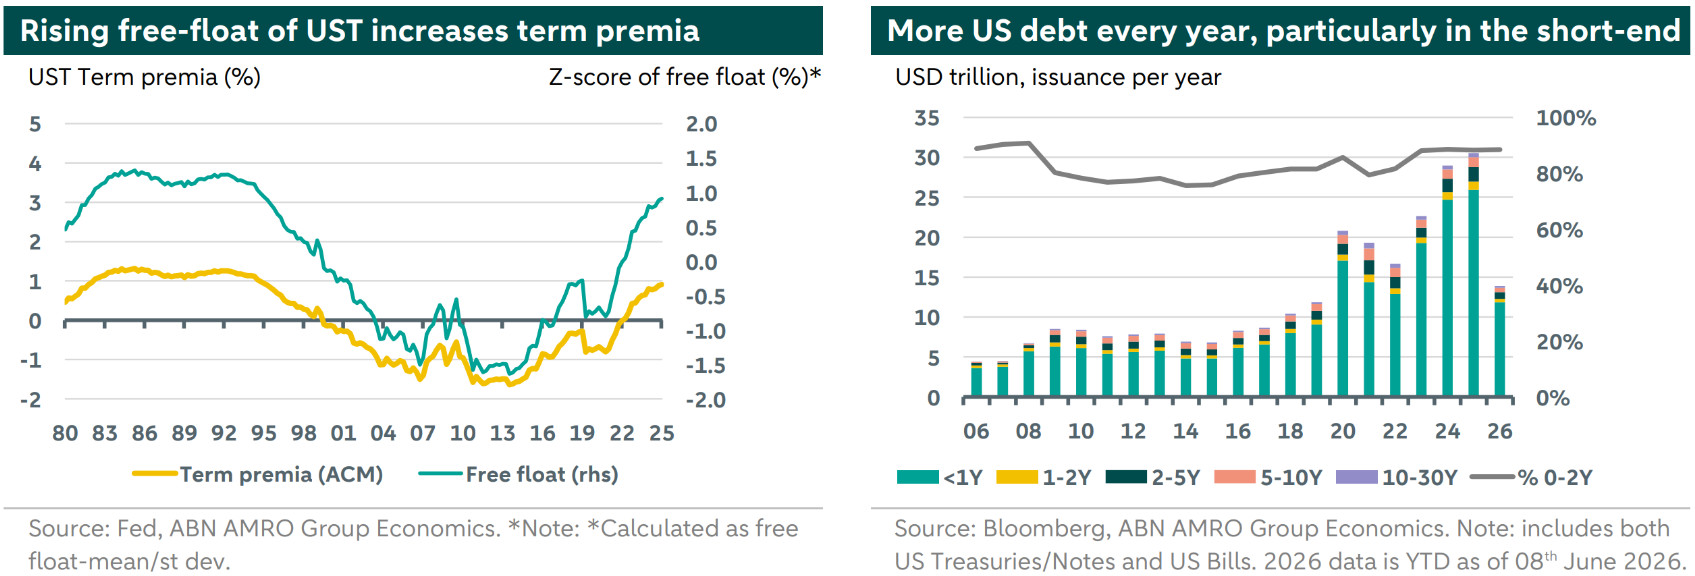
This matters even more because the balance sheet question is colliding with a heavy supply backdrop. Treasury issuance has risen sharply over the last years, with Treasury Bills accounting for a large part of this increase in absolute terms, although the share of short-term debt relative to the long-term has remained relatively stable since 2023 (see right chart above). Overall, the outstanding US debt has more than doubled in the last 10 years and is expected to continue to rise going forward. This leaves the market facing an inherited absorption problem: how to digest growing supply at a time where the Fed could be stepping out even further of this market.
The supply story also matters beyond market plumbing. Persistent issuance at higher yields feeds directly into the fiscal outlook by raising the cost of carrying an already large debt stock. For example, a by the Committee for a Responsible Federal Budget (CRFB) suggests that debt held by the public could rise to 125% of GDP by 2036 if the Office of Management and Budget’s projected 3% annual real GDP growth fails to materialize and tariff revenues fall short of expectations (see right chart below). In other words, the debt path becomes materially more problematic under less favorable macro assumptions, which should also put upward pressure on term premia.
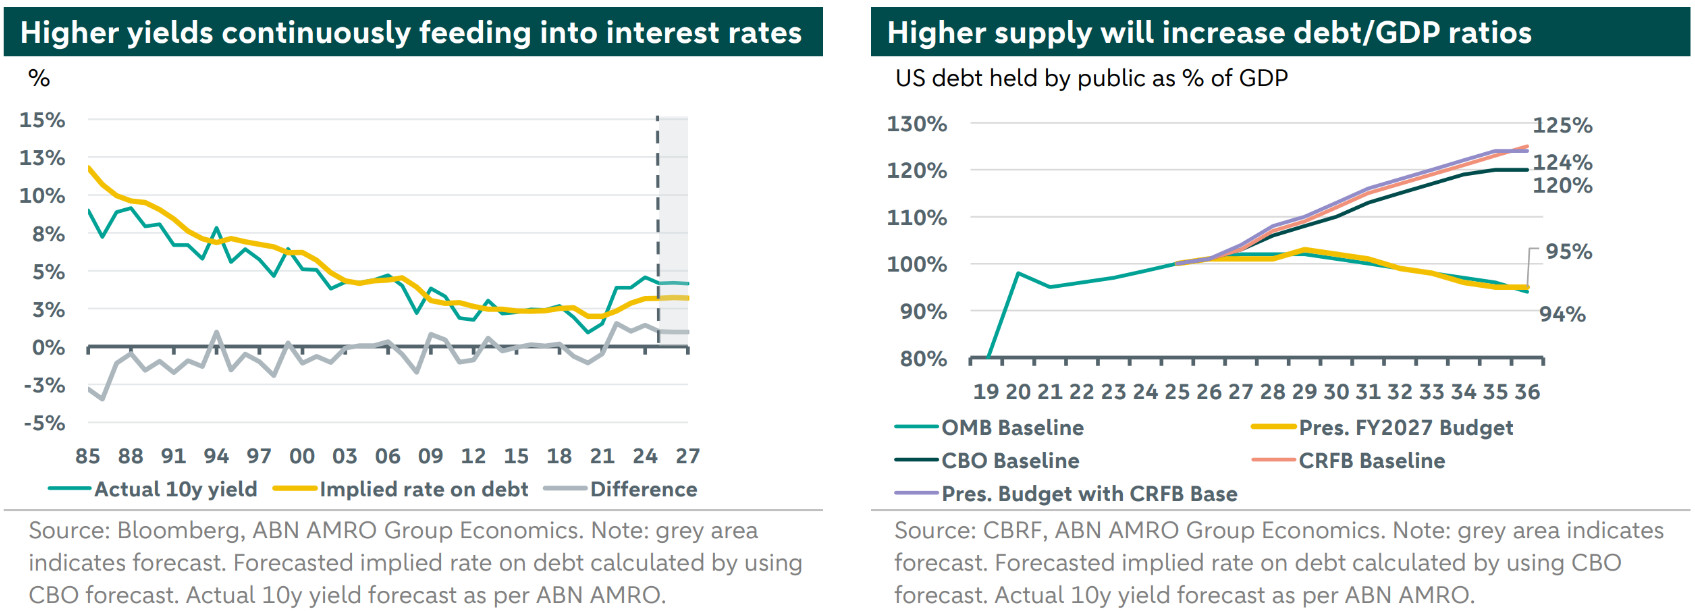
There is also a more immediate issue. Since 2022, the implied rate on US government debt has moved above the actual 10y Treasury yield and remained there, which is highly unusual by historical standards. In practice, that means that the cost of servicing debt is significantly lagging the market and is therefore is expected to rise going forward. Furthermore, as we previously noted, the higher supply has followed previous debt maturity mixes, implying that around 90% of the growing supply is issued in short-term format, with maturity of up to 2 years. This increases rollover risk, as short-term debt must be refinanced more frequently and at higher rates. Overall, higher interest costs then widen deficits further, meaning rate volatility and fiscal concerns reinforce one another, making it harder for term premia to fall back quickly.
Taken together, the outlook is one where even a gradual reduction in the Fed’s footprint would add pressure to a Treasury market that is already under pressure from rising supply and a less comfortable fiscal backdrop. That keeps the structural bias in yields tilted upward. The next question, then, is whether the buyer base is strong and stable enough to absorb this growing supply without requiring a higher risk premium.
The demand side is becoming less stable
These concerns would be less problematic if demand for Treasuries would still be concentrated among long-term, buy-and-hold investors willing to absorb rising supply. But that is no longer the case as one of the more important changes in recent years is that the market has become less dependent on official or foreign buyers and more reliant on domestic investors.
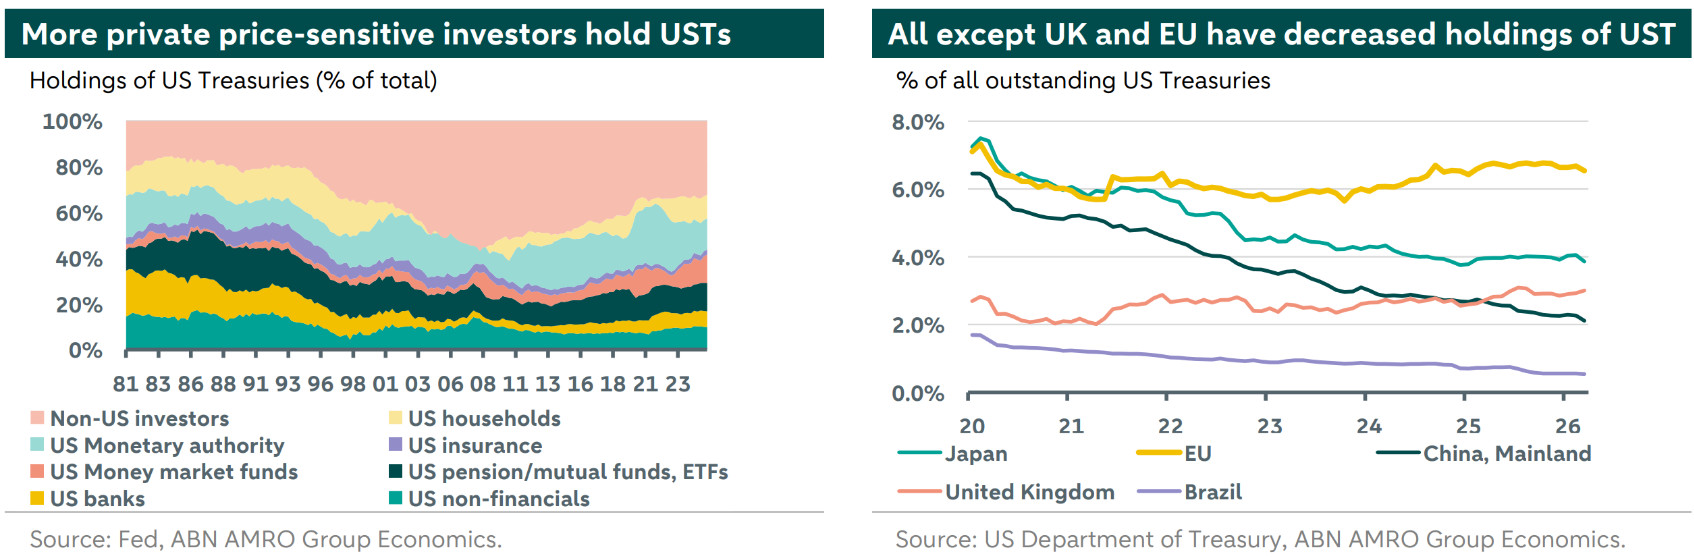
While the shift of foreign to domestic demand is not a problem per se, the problem is that domestic demand is concentrated among price-sensitive investors who are less suited to absorb duration. This makes the overall market more cyclical and more vulnerable to shifts in yields. The chart on the next page on the left shows that foreign investors make up a smaller share of the Treasury market than they used to, while the increase in holdings has come mostly from the domestic investors, especially households, but also money market funds, pension funds, mutual funds and ETFs. In fact, looking at the five largest international investors, we see that all, except UK and EU, have decreased their holdings of US Treasuries (see right chart on the next page). In the case of EU, the share has remained broadly stable over the past six years.
Furthermore, these “new” domestic buyers are not all natural long-duration investors. Households, which also capture leveraged hedge fund activity, tend to be more price-sensitive and can amplify moves when positions become crowded or funding conditions tighten. Money market funds can absorb front-end paper, but by design they cannot provide the durable demand needed further out the curve. Pension funds and mutual funds provide some stability, but not enough to fully replace both the Fed’s retreat on the years it undertook QT and the slower pace of foreign absorption.
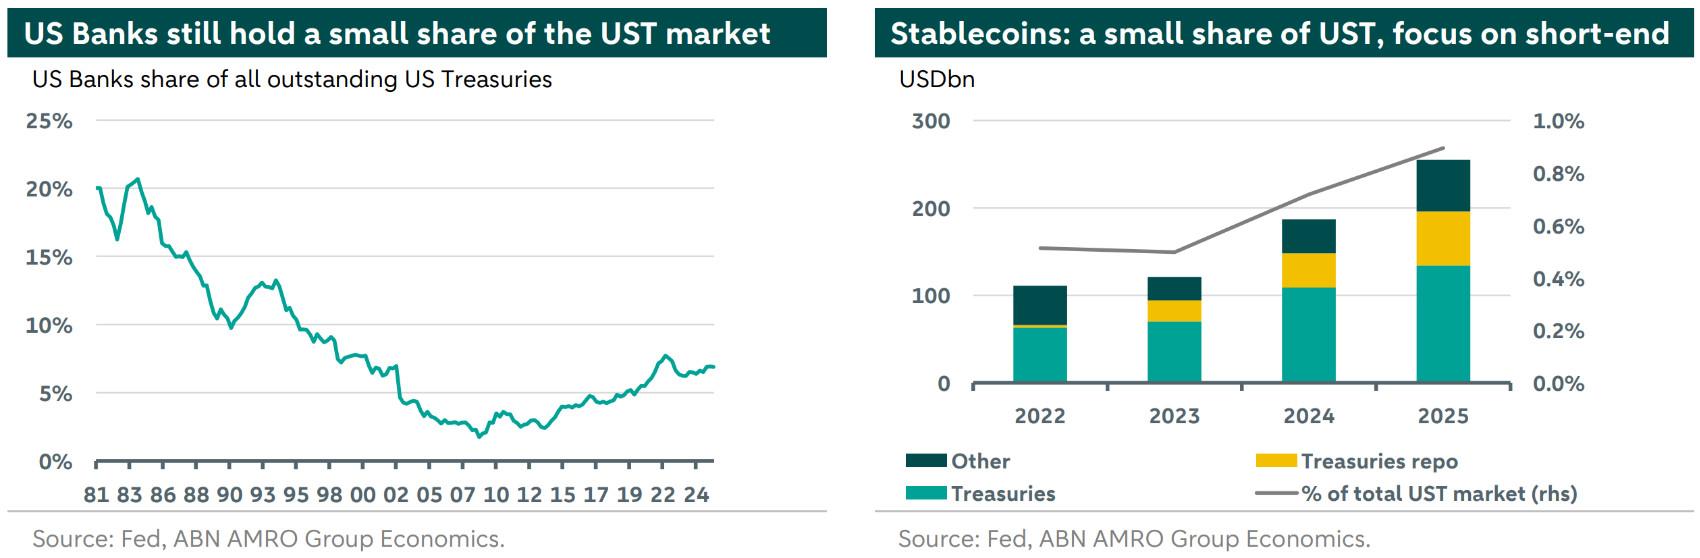
Another risk that could add pressure to Treasuries is a potential reform of banks’ Liquidity Coverage Ratio (LCR), which could ease requirements for holding High Quality Liquid Assets (HQLA) such as Treasuries. US banks currently hold about 7% of outstanding Treasuries, up from a low of 2% in 2008–09 (see left chart below). If those holding requirements are relaxed and the US Banks reduce their holdings of Treasuries, other investors may need to absorb more of the growing supply. It is important to note that other regulations, such as the eSLR finalized in December 2025, could provide some tailwinds to Treasuries. However, we see the introduction of the new regulation as having impact on the speed at which dealers can move Treasuries, rather than on increasing their structural demand.
Furthermore, a potential pick-up of the use of stablecoins could also modify the type of demand for US Treasuries. A stablecoin is a digital asset that is designed to be used as mean of payment. Since July 2025, stablecoins are required to be fully backed by assets such as US dollars and US Bills (more specifically, notes with a remaining maturity of up to 93 days or less, see ). This concentrates demand entirely at the front-end of the curve. Currently, stablecoin issuers hold less than 1% of the US Treasuries outstanding (see right chart below), but a further growth of this market could increase demand for short-term paper. Overall, the demand for mainly Treasury Bills coming from stablecoins is mechanical and inelastic. That is, it is driven purely by the growth of the stablecoin market and not by safe haven and/or yields views. This makes this demand structurally different from other traditional buyers and also subject to fluctuations of another asset class: stablecoins.
As such, the market is now left with a less stable demand mix, with less long-term buy-and-hold investors, at exactly the time supply pressure is increasing. Furthermore, both demand and supply have been so far concentrated on the short-end part of the curve. That leads to not only a higher exposure to refinancing risks, but also demand becoming structurally more fragile and confidence-contingent. The combination created a market whereby small frictions could cause serious disruptions. All this should lift both volatility and the risk premium embedded in yields going forward.
Conclusion
Given the above, our view is that a Warsh Fed would likely aggravate an already difficult structural backdrop for Treasuries rather than be the origin of it. History suggests that leadership transitions are often followed by higher yields as markets reprice the policy regime, a move that has not yet fully materialized. This is due to a period of policy uncertainty that follows a Fed Chair transition, which we think markets have not fully priced in. Even if Warsh’s preference for lower rates appears supportive for the front end of the curve, it would not necessarily be benign for the broader Treasury market if it comes at the cost of Fed credibility or policy discipline. Warsh has also long argued that policy should be conviction-based rather than data-driven, which increases the chance of inappropriate policy.
However, more than that, the bigger issue that markets have to face is that Warsh begins his Chair term at a weak starting point for Treasury markets. In earlier transitions, the market could still rely on a more stable buyer base, a less stretched fiscal outlook and, at times, a more supportive Fed balance sheet. Today, none of those cushions looks particularly strong. Overall, if the Fed delivers the rate cuts we expect, bond yields should come down at the front end. However, the broader backdrop still points to higher term premia, which should limit the scope for a sustained rally further out the curve. In other words, the concern is not that Warsh single-handedly changes an otherwise benign Treasury outlook. Rather, he takes over at a point when the market is already fragile, and his appointment could make those existing vulnerabilities harder for investors to look through.
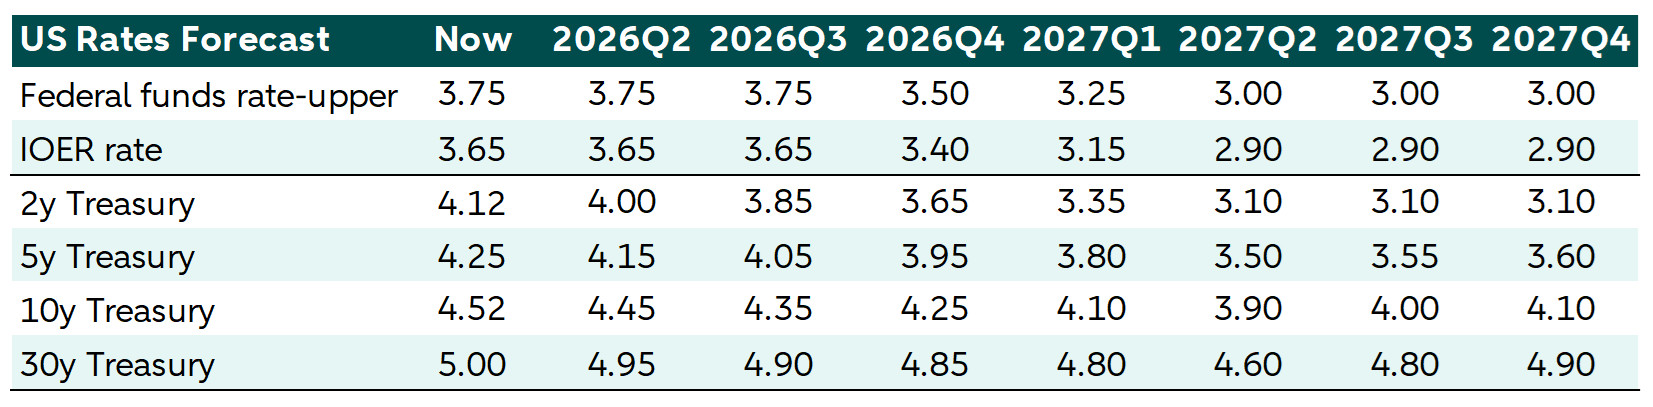
ABN AMRO Forecast for US Treasuries