Transaction Trends - The pension transition - More pension, more spending?

This year, approximately 1.5 million Dutch retirees are noticing the effects of the pension transition in their wallets. Based on anonymized transaction data, we analyze the spending impulse resulting from the “conversion bonus” (invaarbonus), the additional pension indexation due to the transition to the new pension system. Retirees spend on average only 22% of an extra euro of pension income. This percentage declines at higher ages. Retirees with lower incomes or limited financial buffers tend to spend a larger share of the additional income. Despite the relatively small percentage effects, the size of the conversion bonus, combined with a large number of elderly people, still provides a modest boost to the Dutch economy.


Retirees notice the pension transition in their wallets
The pension transition is one of the largest reforms in the Netherlands in recent decades. Everyone who is building up or has built up a pension in the Netherlands will be affected. For the approximately 3.75 million retirees, the financial consequences are directly noticeable. Depending on the pension fund, they receive a often substantial structural indexation of their pension income. After several smaller pension funds made the switch to the new pension system last year, this year an estimated 1.5 million pensioners are experiencing the effects of the pension transition in their wallets.
In this publication, we focus on the macroeconomic spending impulse resulting from the so-called “conversion bonus” (invaarbonus): the, in some cases significant, increase in pension benefits when transitioning from the old to the new pension system. Although retirees on average spend only a limited share of each additional euro of pension income, the combination of substantial pension indexation and a large group of recipients still provides a boost to the Dutch economy. This impulse may be modest, but it comes at a welcome time, as household consumption in the Netherlands is already slowing while the effects of the Iran war are yet to materialize.
On average, retirees spend about 22 cents of each additional euro of pension income. This share is higher among “younger” retirees and significantly lower among older generations. Financial position also plays an important role: retirees with lower incomes spend on average 25 cents of each additional euro, while for those with limited financial buffers this rises to around 40 cents.
Research design
For this study, we use anonymized and aggregated transaction data. The analysis includes households that receive a state pension (AOW) income in their accounts. To estimate the spending effects of the current pension transition, we analyze additional expenditures following earlier pension indexation moments in the period from 2022 through 2025. By using anonymized transaction data, we gain insight into households’ actual income and spending, without relying on surveys. In total, our analysis group includes approximately 165,000 households per year, of which 115,000 are single-person households and 50,000 are cohabiting households.
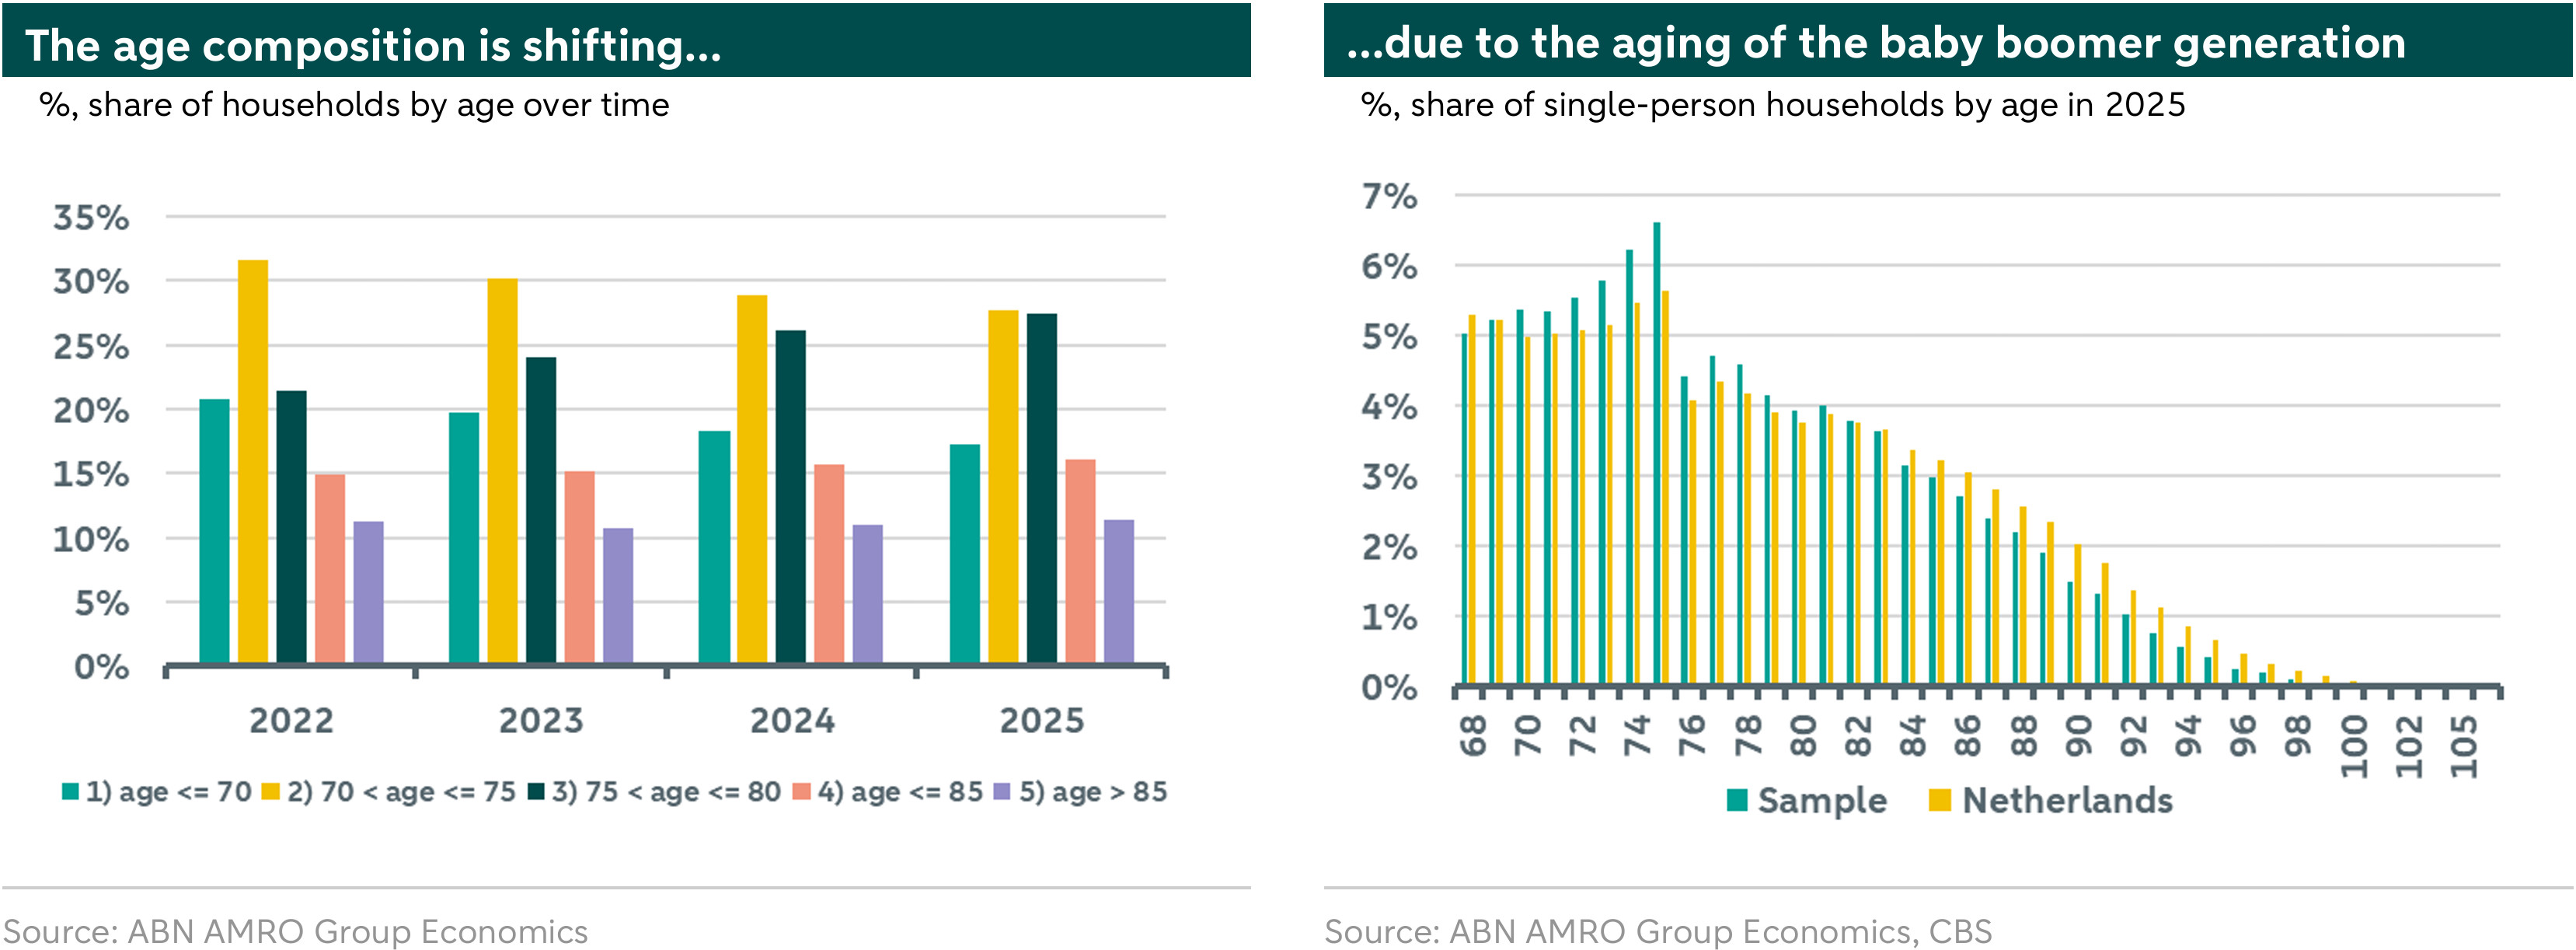
The retirees in our panel become, on average, older over the observation period, despite new inflows and outflows (see the left figure below). In 2022, 32% of households are aged 70–75 and 21% are 75–80. In 2025, these figures are 28% and 27%, respectively. This shift in age distribution is driven by the aging baby boomer generation. Our panel thus closely tracks the aging Dutch population (see the right figure below).
Pension incomes have increased in recent years, …
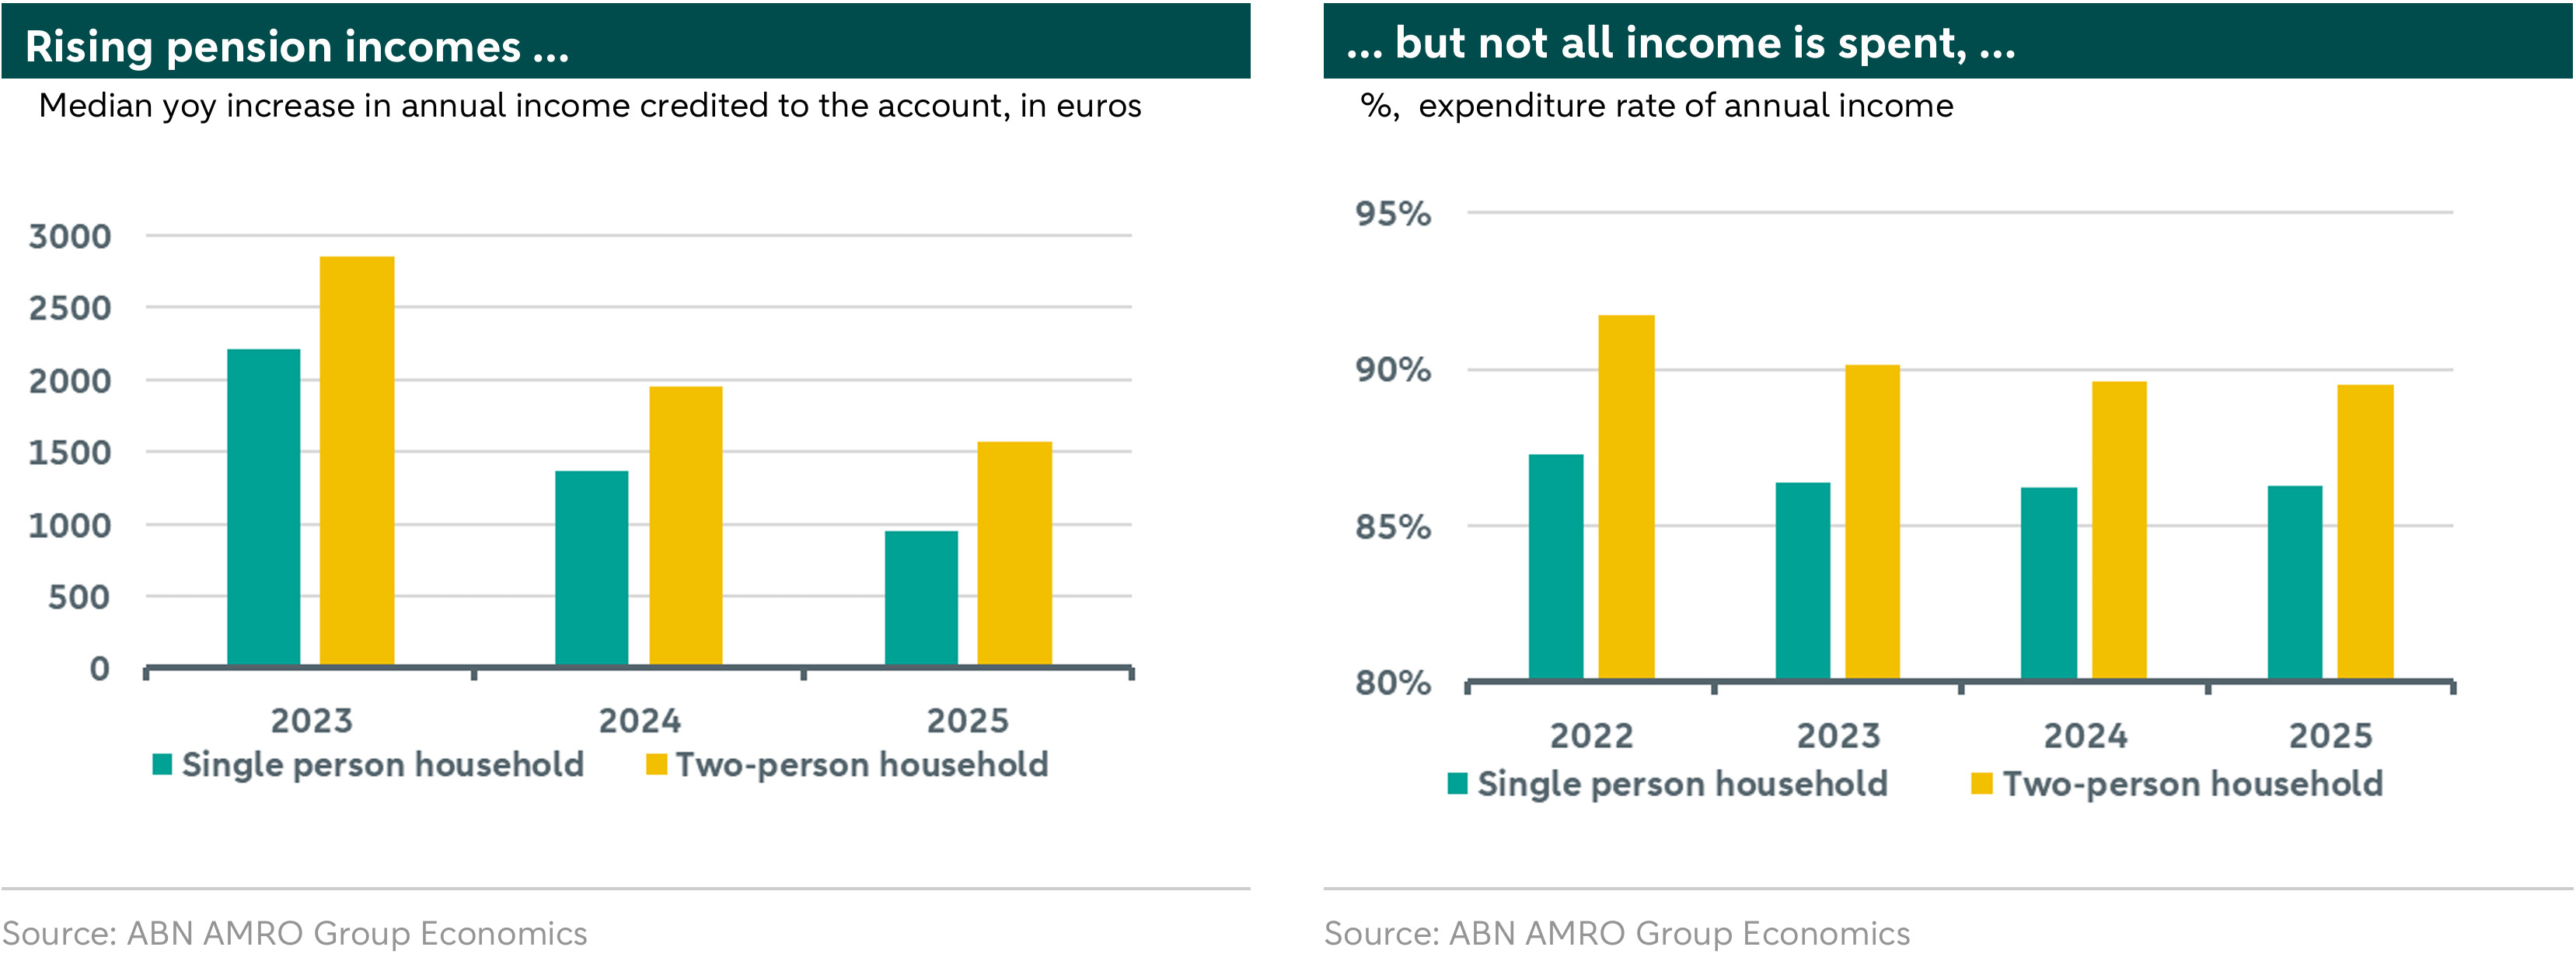
After a long period of minimal pension indexation, pension increases took place again in the years 2022–2025. This was due to improved funding ratios, regulatory easing in anticipation of the transition, and a period characterized by high inflation. In particular, 2023 stands out as a year with substantial pension increases. Many large pension funds applied indexation rates ranging between 5% and well over 10%. Not only did income from pension funds rise, but state pensions (AOW) also increased significantly by 10% in 2023. For pension income, we include income from AOW, pension funds, annuity payments, and allowances. The left-hand figure below shows the median year-on-year growth of pension income in our analysis panel.
… but older people do not spend all their income
The life-cycle model, which still dominates economic literature, assumes that households aim to maintain a stable standard of living—and thus a stable level of consumption—over their lifetime. To achieve this, households save during their working years and draw down their wealth after retirement. However, we observe that the average retired household in our panel spends less than the income it receives. A typical two-person household spends a slightly larger share of its annual income compared to a single-person household—around 91% versus 87%, respectively (see the right-hand figure above). We use a broad definition of annual expenditure, which includes all transactions categorized as spending, as well as unspecified debit card payments, iDEAL payments, and cash withdrawals. Transactions that do not represent actual consumption—such as savings, investments, transfers between bank accounts, and taxes—are excluded.
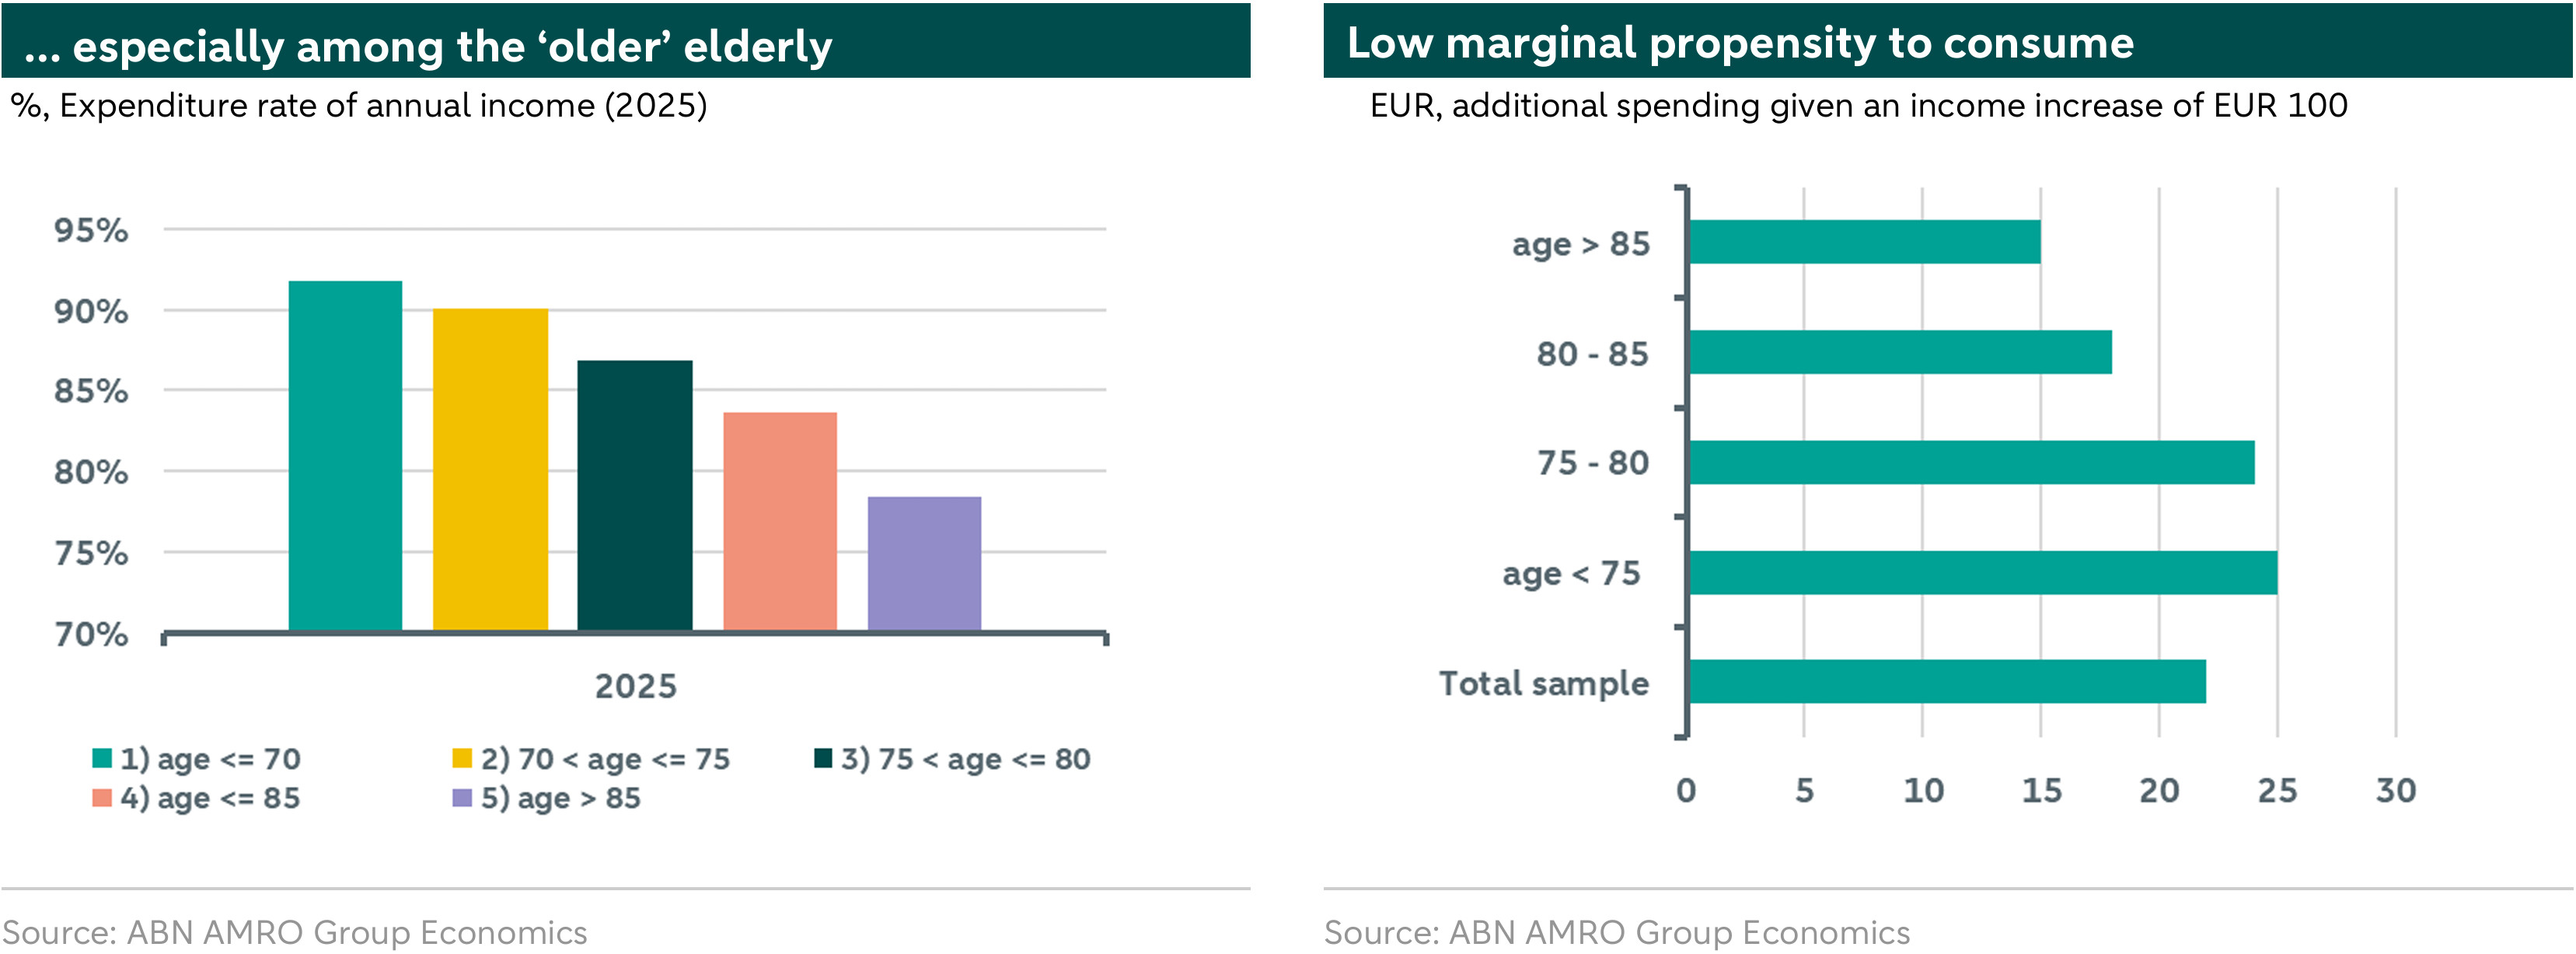
Moreover, we observe that retirees at older ages spend significantly less (see the left-hand figure below). In 2025, a retired household under the age of 70 spends 13 percentage points more of its annual income than a retired household aged over 85. The finding that retirees do not dissave is consistent with other studies in this field, such as those by the CPB and earlier work by Van Ooijen (2015). The broader literature suggests that uncertainty about life events or healthcare expenses, as well as the desire to leave wealth as an inheritance, may reduce households’ tendency to draw down their assets. This has implications for our main question of whether retirees will spend the additional pension income resulting from the pension transition, as it cannot be assumed that they will fully spend this increase in income.
Only part of each additional euro of pension income is spent
We examine how changes in pension income translate into household spending. Pension incomes did not grow equally for all households each year, as pension funds differed in both the timing and size of their indexation. We use these differences to estimate how much households increase their spending following a rise in pension income—i.e. the marginal propensity to consume. To do so, we estimate a panel regression with individual and year fixed effects, allowing us to correct for fixed differences between households and for general developments over time.
Our analysis shows that Dutch retirees spend about 22% of an additional euro of income (see the right-hand figure above). This is a relatively low marginal propensity to consume: the share of an extra euro of income that is actually spent. This spending propensity also varies significantly by age. Higher age reduces the marginal propensity to consume. Retirees younger than 75 spend around 25% of an extra euro, while this share declines to about 15% for those aged 85 and over.
It is perhaps not surprising that at higher ages, demand for certain types of consumption—such as travel, hospitality, or durable goods—declines. The remaining life horizon is shorter, meaning that large expenditures have often already been made, and physical limitations more frequently play a role.
Lower income and limited savings signal a stronger spending impulse
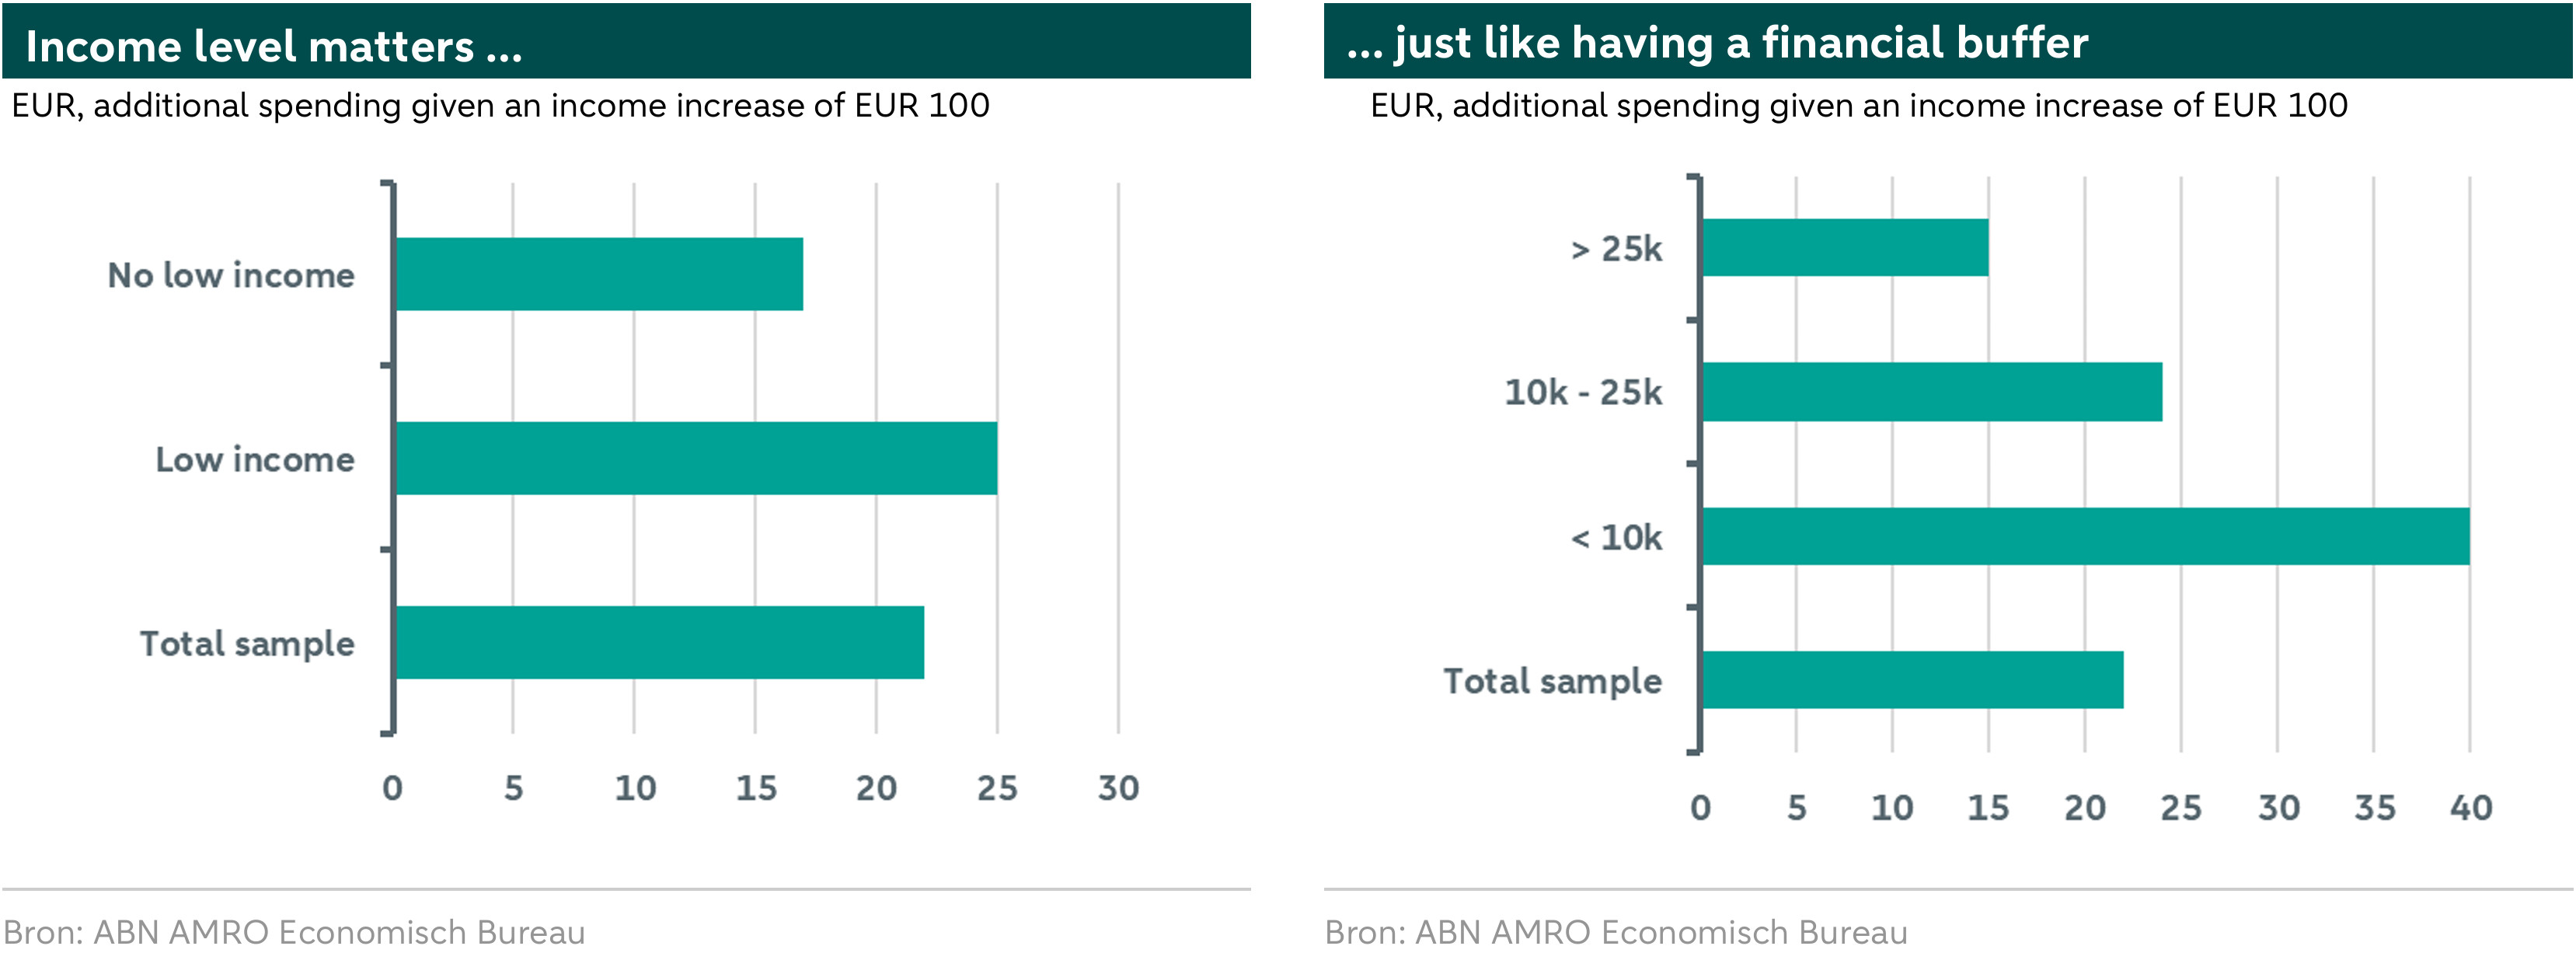
Age is not the only factor determining how much of an additional euro is spent. Income level and the size of a financial buffer are also important. Households with lower incomes—measured by receiving healthcare benefits—spend a larger share of additional income on average (around 25%) than higher-income households (around 17%; see the left-hand figure below).
A similar pattern emerges when looking at financial buffers (see the right-hand figure below). Retired households with substantial savings spend relatively little of additional income (around 15%), while those with limited savings spend significantly more. For this latter group, the marginal propensity to consume rises to around 40%. A smaller buffer thus increases the tendency to spend additional income immediately.
These patterns suggest that differences in spending behavior are mainly related to how financially constrained or comfortable households are. Households with lower incomes or limited buffers are more likely to be restricted in their daily spending and may have postponed consumption, meaning that an extra euro directly creates room to catch up on these expenditures. By contrast, households with higher incomes or substantial savings have largely aligned their consumption levels with their needs, so extra income is less likely to result in additional spending. This is consistent with the broader economic literature, which finds that the marginal propensity to consume declines as financial conditions improve. As a result, income increases among financially vulnerable groups have a relatively stronger impact on the real economy than those among more affluent households.
A modest boost at a time when consumption is slowing
Now that we have mapped the marginal propensity to consume, we can zoom out to the macroeconomic implications. The approximately 1.5 million retirees who will see the conversion bonus (invaarbonus) reflected in their finances in 2026 will experience an average increase of around 14% in their pension benefits from pension funds. Of this income increase, as concluded above, an average of 22% is spent.
A rough calculation suggests this translates into approximately EUR 500 million in additional spending in 2026. Compared with total consumption in the Netherlands—around EUR 105 billion per quarter—this is a modest but not insignificant amount. Timing plays an important role here. Although this spending impulse is limited, it comes at a time when private consumption is slowing, partly due to higher expected inflation and increased uncertainty. In addition, many of the inflationary effects of the Iran war have yet to materialize. Against this backdrop, the expected impulse in 2026 provides a welcome modest boost to the Dutch economy.
The new pension system entails more risk, which may dampen spending
Some important caveats apply to the conclusions above. The analysis is based on indexation moments in the period 2022–2025, whereas the pension increases in 2026 result from a change in the pension system. This brings several specific considerations.
First, the new pension system makes pension benefits less certain, as the investment returns of pension funds will feed through more quickly and directly into benefit levels. This not only increases the potential for higher pensions, but also the risk of reductions. Retirees may take this additional risk into account when making spending decisions and may choose to save a larger share of the conversion bonus. At the same time, most pension funds have introduced a so-called solidarity buffer. This buffer can be used to stabilize pension benefits in the event of disappointing investment returns and will be replenished when returns improve. As these buffers are currently well funded at most pension funds—partly due to high funding ratios—it is expected that pension benefits will not decline in the coming years.
Second, the marginal propensity to consume may differ at higher levels of income growth. The indexations in the period 2022–2025 included in the analysis were relatively modest compared with the percentages applied by some pension funds in 2026. With larger increases, spending behavior may therefore differ.
Third, the marginal propensity to consume may be lower because higher incomes can lead to the loss of certain benefits and allowances, meaning the net increase in income is smaller than the gross rise in pension income.
Conclusion
This year, an estimated 1.5 million Dutch retirees are experiencing the financial effects of the pension transition, as their pension benefits are additionally indexed when moving to the new system. In this publication, we analyze—based on anonymized transaction data—the spending impulse this generates for the economy. The findings show that retirees are, on average, cautious in their spending of additional income: of each extra euro of pension income, about 22 cents is actually spent. This share declines further at older ages. At the same time, there are clear differences within the group of older people. Retirees with lower incomes or limited financial buffers spend a larger share of additional income, suggesting that the conversion bonus primarily creates room for extra consumption for these groups. Although the effects at the individual level remain relatively modest, the combination of a substantial income shock and the large number of affected retirees results in a modest but meaningful boost to the Dutch economy overall.
Data and Methodology:
In the publication series titled “Transaction Trends”, we share relevant economic insights based on our ABN AMRO aggregated and anonymized transaction data. We use transaction data to gain a better understanding of economic flows. For statistical research, we use only aggregated and anonymized data. The outcomes of the research cannot be traced back to individuals and are intended solely for analyzing economic trends.
Definitions & panel selection:
In our analysis, we focus on households’ annual pension income and annual expenditures. Pension income includes income from the state pension (AOW), pension funds, annuity payments, and allowances. Expenditures include fixed costs, groceries, and other discretionary spending. Our definitions of fixed costs and groceries are consistent with our previous studies (see here for a description). Discretionary spending covers all other expenditures via debit card payments, iDEAL/Wero, and cash withdrawals. Transactions that do not constitute actual consumption—such as savings, investments, transfers to other bank accounts, and income tax—are excluded from our definition.
Our analysis group consists of approximately 165,000 households per year, including 115,000 single-person households and 50,000 cohabiting households. For the definition of a household, we link all accounts connected through a joint account.
This number of households results after applying several filters. First, we include only households that receive monthly AOW income in their account throughout the entire year. In addition, we use the level of AOW benefits to determine whether the full household is observed. Single-person households are included only if one monthly AOW payment is observed that corresponds to the amount for singles. Multi-person households are included only if two monthly AOW payments are observed that correspond to the amount for cohabiting individuals. Entries and exits of households between years are allowed, meaning the composition of the sample may vary from year to year.